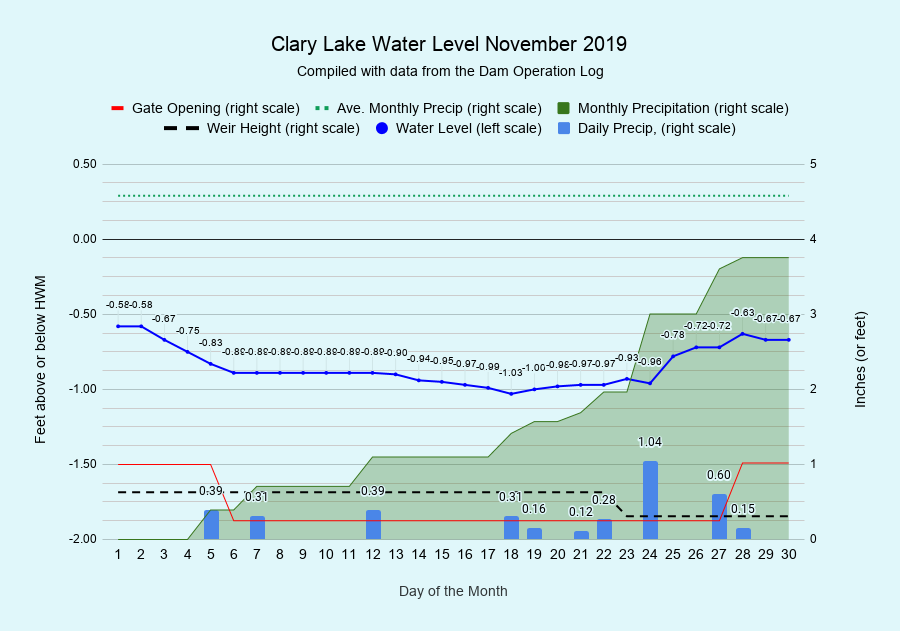
 I have archived the November 2019 Water Level Chart (at left). The most notable thing the November chart shows is nothing much! We got a lot of rain (3.75 inches), but not as much as in a normal November (4.58 inches), the month with the highest rainfall on average. We were hoping to keep the lake level around 1 foot below the HWM without overspending our water budget and we did mostly OK until a series of rain storms in the latter half of the month brought the lake level back up to within less than 1/2 foot of the top of the dam. Rather than overspend our water budget, we ended up with water in the bank so to speak. Not really a problem, but not what we were looking for. We ended the month only a 10th of a foot or so lower that we started. We’re currently letting out close to 60 cfs in an attempt to drop the lake to a more normal level for this season.
As mentioned, we received 3.75 inches of rain in November which is a good deal of rain but still 0.83 inches less that the November average of 4.58 inches. Despite falling short in November, with 42.78 inches of rainfall to date we’re still 2.16 inches above average thanks to the excessive rainfall we received in June and October. It looks like we’re going to end the year well above average precipitation which bodes well for ground water and Spring runoff.
In addition to the water level, the monthly charts also show daily rainfall amounts, the average monthly rainfall, and gate and weir settings.
We started 2019 recording water level measurements daily, partly because we were new to this dam operation thing and we wanted to learn as much as possible about how the lake level responded to different gate and weir settings, and weather events, and partly because I’d already gotten into the habit of recording daily water levels after doing so for 7+ years. Daily measurements just came naturally. The WLO actually gives us little guidance on this question. In any event, while I designed the Dam Operation Log to handle periodic and not necessarily daily water level data, we’ve continued making daily measurements throughout the year. Our 5 person Dam Operation Committee has been doing a great job with everyone taking roughly 2 week turns at measuring the water level on a rotating cycle. Starting in January (maybe even this coming December) we’ll start recording water levels on a somewhat more relaxed schedule. We’ll still record water levels more often during the Summer boating season, and during periods of rapid change.