
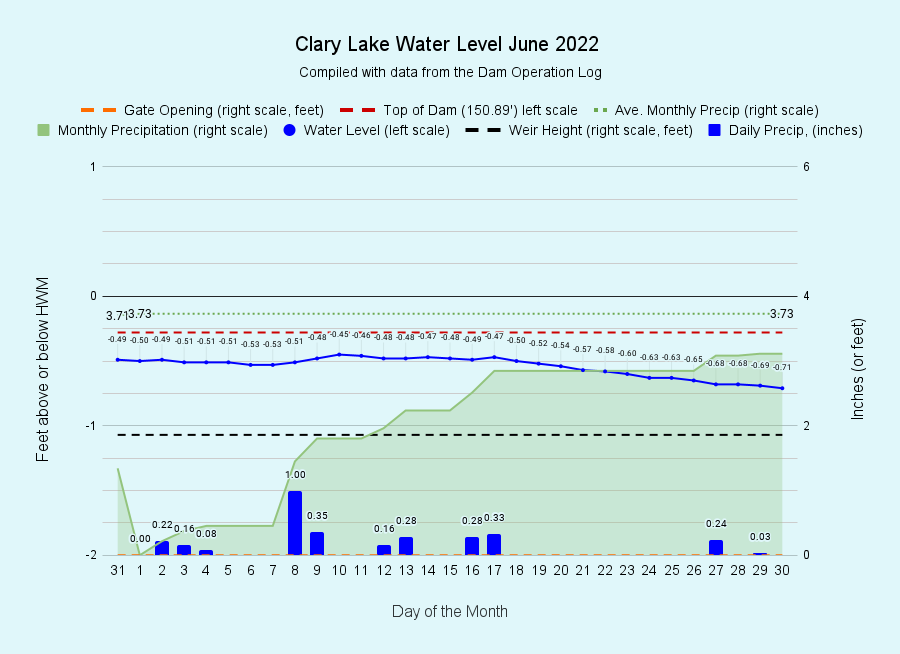
I have archived the June 2022 Water Level Chart (at left). The lake level in June looks a lot like the lake level in May only about 3″ lower than in the previous month. We did receive a more rain in June than we did in May, but most of it fell in the first half of the month which was enough to largely offset the water loss leading to more or less stable water level, up until the 17th of June. Rainfall for the rest of the month was almost nonexistent and by month’s end the lake had fallen a quarter of a foot, ending the month about 3 inches lower than it started. The 3.11 inches or rain we did receive fell about 0.6 inches short of the June monthly average of 3.71 inches. Because we received so much “extra” rain in the first 4 months of 2022, we’re still 0.8 inches above normal for this date. However, as I’ve explained before, simply looking at total precipitation gives you an unrealistic picture of actual ground water conditions and like last month, almost the entire coast of Maine (including Clary Lake) is considered to be “Abnormally Dry” by the USDA Drought Monitor program.
If you think the lake is a little low for this time of year, you’re right, it is! While still in the “normal” range for this date, at -0.71 feet below the HWM, the lake is slightly lower now than it has been in the last 3 years. The last time it was lower than this, on this date, was back 2018 before we owned the dam. Under the watchful eye of the then dam owner Pleasant Pond Mill LLC, the lake level was over 4 FEET below the HWM. So in comparison, really, the lake level today it doesn’t seem so bad 🙂
As to WHY the lake level is as low as it is today, chalk it up to leaks and evaporation with emphasis on evaporation. Of those two causes, evaporation by far causes the most water loss from the lake. Leaking is currently estimated to be approximately 2 cfs (cubic feet per second) which really isn’t much, and even a modest amount of rain is usually enough to offset the losses caused by that amount of leakage and evaporation combined- notice how level the lake level was for the first 17 days of the month! 2 cfs of water loss amounts to a drop in the lake level of about 0.006 feet per day (about 1/16th of an inch) which amounts to a little over 2 inches in 30 days. Evaporation on the other hand can easily result twice as much or more water loss in the same period. 1/8 inch or more per day is not unusual, depending on weather conditions. Hot, dry, windy days can greatly increase evaporation while cloudy calm humid days can have the opposite effect. We guestimate daily evaporation by comparing how much the lake should fall given the outflows and how much it actually falls. While this approach isn’t perfect, it does give a reasonable approximation of evaporation. See the Flow Statistics on the Clary Dam Operation Log for this data!
There’s not much we can do about evaporation, but leaks is another matter! They’re only going to get worse, and we’ve begun making plans for making additional repairs to the dam though realistically, any actual work on the dam is still a few years off. If you want to help, buy a raffle ticket 🙂