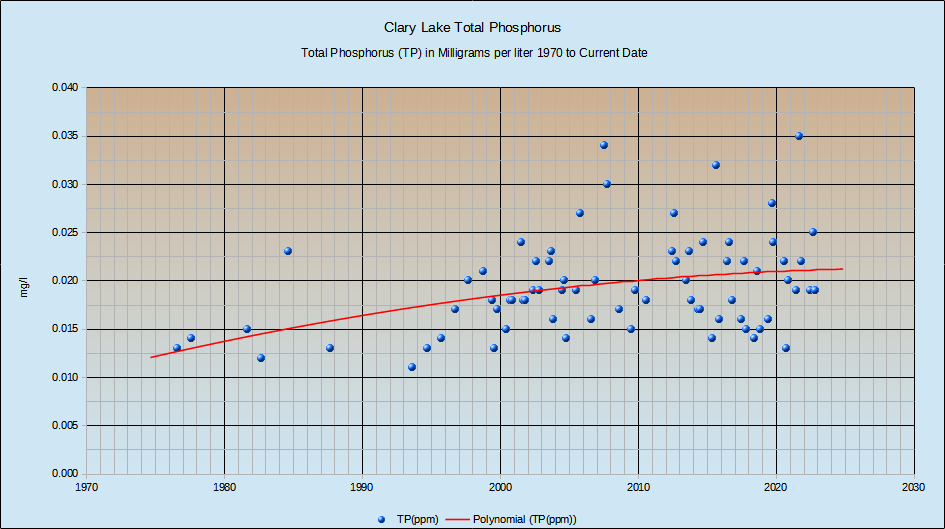
Total Phosphorus Chart
The Total Phosphorus test results from our 8/6/2021 core water sample came back the other day at 0.035 mg/liter, the highest TP value we’ve ever recorded. This is ominous. The next highest value we recorded was 0.034 mg/liter in July 2007 (see chart at left). I don’t remember the particular circumstances surrounding that reading, but there was another high TP reading of 0.032 mg/l more recently, in July 2015 that I do remember. It coincided with a secchi disk reading of only 1.95 meters indicating an algae bloom was in progress (secchi disk readings of 2 meters and below indicate a bloom in progress). You can see this 1.95 meter data point on the chart showing Clary transparency below. In this particular case, extreme low water conditions were a major contributing factor to poor water quality!! I expected a high TP value this time because of the 9″ of rain received in July. Rain means runoff and runoff means soil erosion and sedimentation which is the primary source of Phosphorus in lakes, but still, I was surprised to see such a high number. High phosphorus levels are not good for water quality! We really need to update our Watershed Survey!
Despite the high phosphorus level, we haven’t seen a significant algae bloom yet this summer and we may not, though I did notice a few wisps of dead cyanobacteria along the shoreline back in August, and water transparency is currently holding up nicely: at our last the water monitoring session on Sunday September 5th, Kelsie French and I had secchi disk readings of 3.55 and 3.45 meters respectively which is about average, and better than expected considering the level of phosphorus in the water. Transparency could deteriorate quickly however and we’re going to keep a close eye on it; we will take our 3rd and final water sample for Phosphorus testing during our next water quality monitoring session in a couple of weeks.
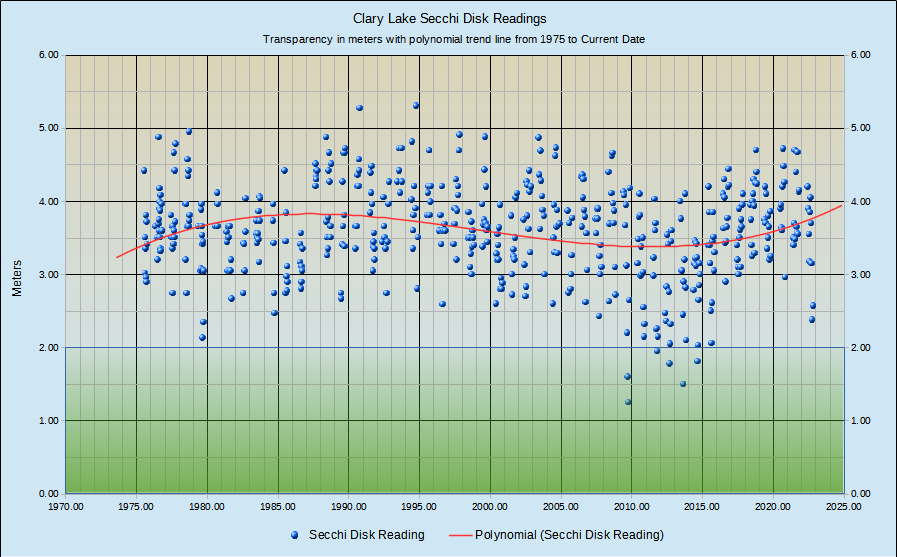
Clary Transparency
The highest risk period for algae blooms is typically in early fall which is just ahead so it could still happen. In the summertime, the lake is well stratified with warmer, oxygen rich water on top and colder, oxygen deficient water at the bottom. The transition zone (or thermocline) is often sharply defined, occurring between 2 and 4 meters below the surface. Swimmers are quite familiar with this feature of lake water! In the fall, the lake “turns over” and mixes and Phosphorus that was released into oxygen deficient (anoxic) water at the bottom of the lake during the summer mixes with the upper sunlit layers of water where algae are hanging out. This provides the cyanobacteria with a literal shot in the arm and often spurs rapid algae growth. We saw evidence of this fall “turnover” having already begun during our last water monitoring session last Sunday: the sharply defined thermocline was gone with the water temperature ranging from 21.7° C at the surface to 18.0° C at 8 meters, a variation of only 3.7° C which is much less than the typical 10° gradient we see during the summer. There was however still markedly oxygen deficient water in the bottom 2 meters of the lake. When the lake is thoroughly mixed it will be of a largely uniform temperature and oxygen saturation from top to bottom and will remain that way until Spring when the lake starts to warm up and the stratification process starts over.
The bottom line: a fall algae bloom may be on the way. We should know in a few weeks. You can keep track of our water quality on our Clary Lake Water Monitoring Data page.