
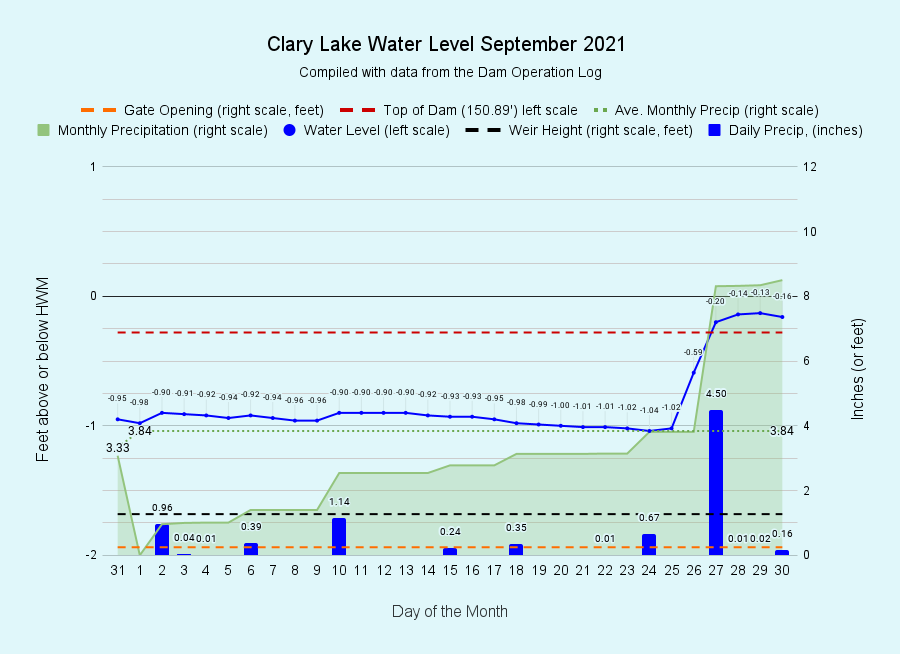
 I have archived the September 2021 Water Level Chart (at left). September was on track for being an average, ho-hum kind of month with more or less normal rainfall (for a change!) and a stable unchanging water level until the 27th when we received a whopping 4.5 inches of rain in one storm. This sounds like a lot, and it was a lot, but it only brought the lake up 0.89 feet, from -1.02 feet below the HWM to just -0.13 feet below it. While this sounds like a lot, it’s actually a runoff multiplier of only 2.4X and considering how much rain we’ve had this summer, I expected the lake to have come up a lot more. By all rights we should have had water pouring over the full width of the dam but in fact we just had a wee bit dribbling over the top in a few spots. I won’t say I was disappointed, but I was surprised! The old rule of thumb is that an inch of rain should bring the lake up 4″ (a 4X multiplier) and if that rule had held true, the lake would have risen 18 inches instead of only 10 inches. For that matter, we’ve actually seen runoff multipliers considerably larger than 4X in the past.
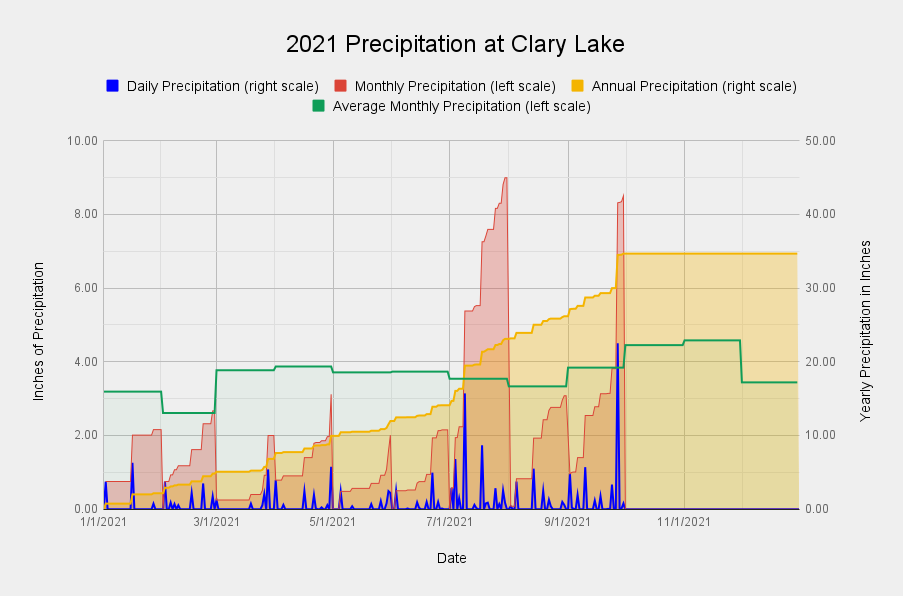
So what’s going on? To put all this in perspective: despite all the rain we’ve received this summer, we’ve still been playing catchup the whole year with accumulated monthly precipitation falling short of normal until the very end of September (at 34.67 inches we’re now fully 3 inches above normal for this date). In other words, the groundwater supply has been low meaning it’s capacity to absorb water has remained quite high. The result is that when it rains, water tends to soak into the ground rather than run off into the lake. The 2021 Precipitation Chart (above) tells the story. The green line represents average monthly rainfall and the red line actual accumulated rainfall for each month. For the first nine months of this year (with the exception of February which had a normal amount of precipitation), monthly rainfall has fallen short of average for 6 of those 9 months and in some cases, drastically so: by the end of June, we were fully 6.78 inches SHY of normal for that date. In other words, we were in severe drought for most of the year and falling further behind each month until July, and ONLY THEN did we start to catch up.
What should now be clear is that just groundwater isn’t necessarily replenished very quickly. Short intense rainstorms result in more runoff with less water sinking into the ground. On the other hand, slow gentle rain results in more water soaking into the ground and less of it running off into the lake. Water is also absorbed into the surrounding ground when the lake level rises, and flows out of the ground into the lake when the lake level drops. Clearly, how much the lake will rise for a given amount of rain depends on a variety of factors!
Algae Anyone?
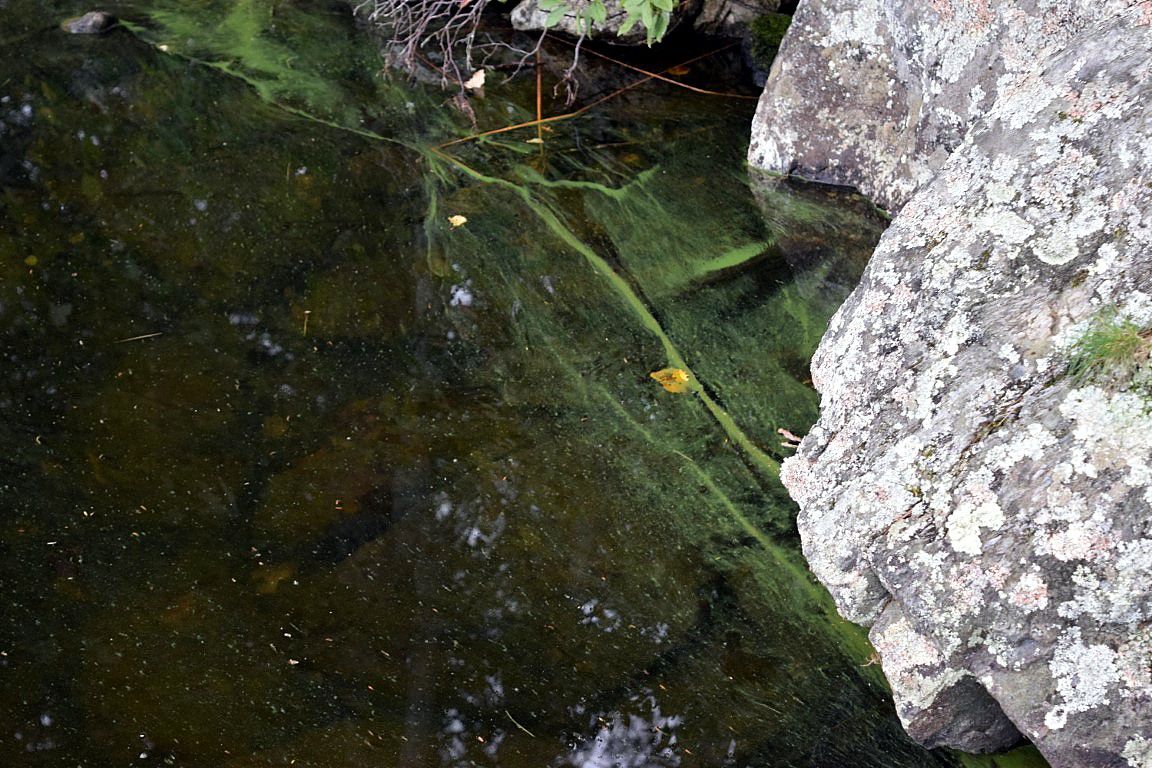 Runoff into the lake brings with it sediment and Phosphorus and it remains to be seen what the impact of the heavy rain in July (9 inches) and September (8.5 inches) will have on Clary’s water quality. I’ve previously expressed my concerns about the high Phosphorus level in Clary this summer (see September 2021 Water Quality Update). At our most recent water quality monitoring session on September 26th Kelsie French recorded a secchi disk reading of 4.13 meters (13.5 feet) which is quite good under the circumstances. The next day I noticed some dead cyanobacteria washed up along my shoreline (picture at left). We’re not having an algae bloom (technically defined as a secchi disk reading of less than 2 meters) but clearly there’s some significant algae growth taking place. It is to be expected, especially this time of year after the fall turnover. Time will tell if it gets worse, but I’m not too worried about it. Kelsie and I also took a third water sample for Phosphorus testing and should have the results back in a few weeks. Kelsie and I are going to try to get out water quality monitoring one more time this fall, weather and time permitting.
George, great explanation and information. Thanks