November 2020
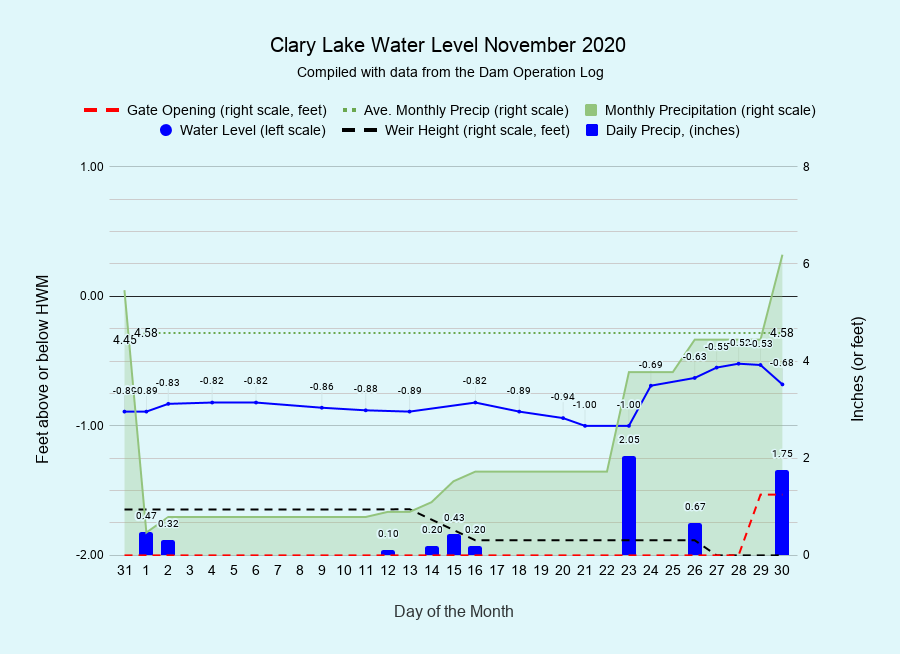
I have archived the November 2020 Water Level Chart (at left). We were a little worried that the fall drought conditions were going to continue into November so we’ve been operating the dam so as to maintain a decent store of water going into Winter, releasing only the required minimum flows. For the first 3 weeks the dearth of rain did continue and the lake level had fallen to 1 foot below the HWM. Then on the 23rd of the month we received over 2 inches of rain and it began to look like we’d end up with well above the normal amount of precipitation for the month. On the last day of the month we received an additional 1.75 inches of rain (glad it weren’t snow!) bringing us to 6.19 inches for the month bringing us to 40.2 inches for the year to date, still 0.42 inches below normal. It’s now Tuesday morning December 1st and it’s still raining and that 0.42 inch deficit is already history, pushing us above average rainfall for the year to date. You’ll find the 2020 Precipitation chart on the Clary Dam Flow Statistics page (along with some other cool graphs). It would appear that the 2020 drought is about over.
In anticipation of heavy rain on the last day of the month, on Sunday morning the 29th of November we opened the dam’s gate 1.25 feet to lower the lake level some and increase capacity for storing storm water runoff. We had already removed the last stop log in the weir last week and the gate had been closed all month. Opening the gate allowed for a total release (combined gate and weir outflows) of 79 cubic feet of water per second (cfs) which over two days had the desired effect of creating some “headroom” for runoff- not a lot, but enough to prevent major flooding. You can see the effect of this water release on the above chart.
At the time of this writing the on the first day of December, the lake level had already risen to the top of the dam and was beginning to trickle over in a few low spots (check out the Current Water Level Charts). We’re still shedding a lot of water, current outflows are around 87 cfs so we expect the lake level to start falling again quickly. We’ll close the gate again and slow down the outflows once the lake level is back down around where we want it this time of year, roughly 1 to 1.5 feet below the HWM so as to prevent damage to the shoreline and the dam when the lake finally freezes.
Be sure to check out the Dam Operation Log for more charts and data!
Many thanks to the Dam Operations Committee for their careful attention!