
May 2021
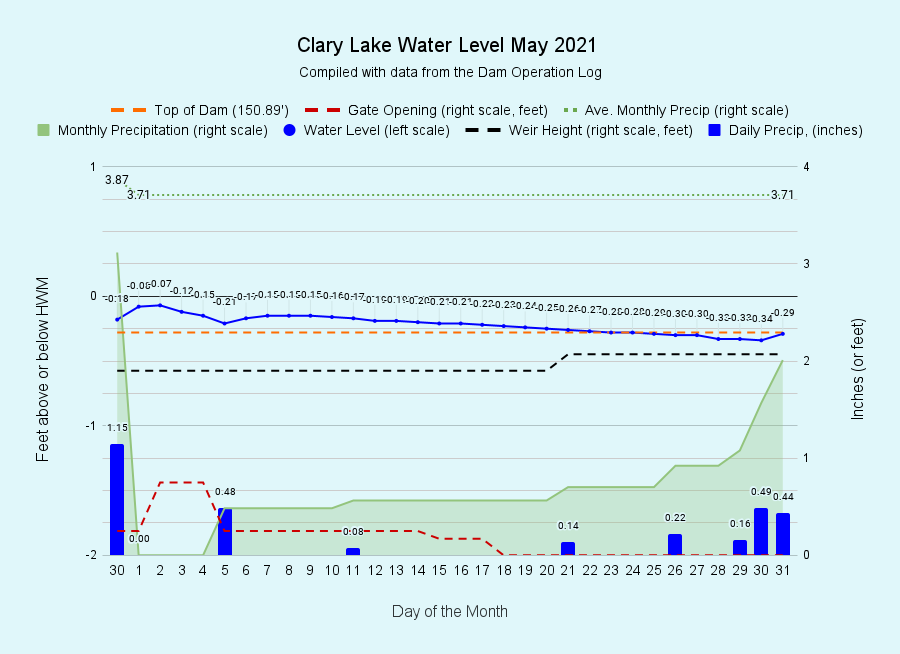
I have archived the May 2021 Water Level Chart (at left). The dearth of precipitation which has plagued us all winter continued through the month of May. At the end of April we were 3.50 inches short of normal for the year and today, on the last day of May, having received an underwhelming 1.91 inches for the month (normal for May is 3.71 inches), we’re now worse off at 5.20 inches short of where we would be in a normal year. It would have been even worse but for the 0.93 inches of rain we received on Memorial Day, the last day of the month. The timing was lousy but the rain itself was very much needed and I’m glad we got it. It also seemed like a fitting end to a long cold weekend that had me burning wood in my stove again; I’m OK with putting on a sweater in the house but I draw the line at wearing gloves at dinner! The three day weekend also marked the start of our Courtesy Boat Inspection program and unsurprisingly, we didn’t inspect any boats entering or leaving the lake. It was not the 3 day weekend you were looking for!
Officially this area of Maine is considered to be Abnormally Dry which I personally consider optimistic. Despite the lack of rain however, we still managed to keep the lake level more or less where it belongs this time of year with a little water trickling over the top of the dam until about May 24th. In an attempt to preserve as much water going into summer as possible, we made numerous adjustments to the dam during the first part of the month, finally closing the gate completely on the 18th. On the 21st we added a 2 x 4 to the weir, shutting off all outflows from the lake except for minor leaking which we estimate amounts to about 2 cubic feet of water per second. Under these circumstances of minimal outflows, when you see the lake level dropping, know that it’s mostly due to evaporation and not because of outflows at the dam. We’ll do what we can to preserve a decent lake level this summer, but what we really need is rain, and a lot of it.
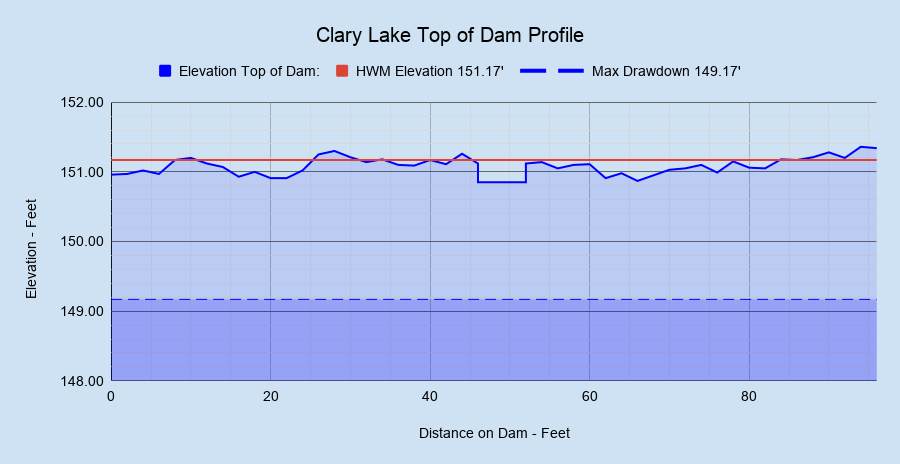 Another indication of how dry it’s been is that unlike the last two years, so far this year the lake level has never reached the High Water Mark elevation of 151.17 feet (NAVD 88) though we did get to within an inch of it, early in the month. However, as most of you know by now, a) the top of the dam is not flat and b) that HWM elevation, established by survey by DEP back in 2014 as part of the Water Level Petition process, is actually ±3 inches above the lowest point on the top of the dam. In the picture at left, think of yourself standing on the road looking at the dam. The crooked blue line is the profile of the top of the dam (yes, exaggerated) the red line is the HWM elevation, and the dashed blue line is the 2 foot lower limit of how far we can take the lake down. the rectangular section in the middle of the dam is the weir. The lowest point on the top of the dam is about 6 feet to the right of the weir which has an elevation of 150.89 feet. You’ll find this chart (and more!) on the Clary Dam Operation Log.
You’ve got to believe, it’s darn hard to manage that 3 inches of water, as much as we’d like to. We might like to keep it in the lake for a while but all it really wants to do it run over the top of the dam and head down stream. Bummer. However we have become reconciled to this situation and to the fact that 12.5% of our 2 feet of manageable water, afforded to us by the Clary Lake Water Level Order, is in fact, unmanageable, and therefore we consider the lake to be filled to its “full capacity” (our primary mandate) when the water is up at the top of the dam. That’s our story and we’re sticking to it.
Since archiving the April Water Level Chart Kelsie French and I have resumed our Water Quality Monitoring on Clary Lake for the 2021 season. We were out 3 times in May. As windy was it’s been this past month you shouldn’t be surprised that secchi disk readings between 3.40 and 3.70 meters suggests the lake water is somewhat murky. I expect it will clear up as summer advances. Our first Total Phosphorus test result came back a few days ago at 0.019 mg/L (milligrams per Liter). This is about average for us. The average of the first phosphorus tests of the year going back to 2012 is 0.0183 mg/L so it’s marginally higher than what we’ve seen in early Spring, but the average of ALL our Total Phosphorus tests going back to 1976 is 0.0190 mg/L so it’s very much average. Average is good. Clary water quality tends to improve under drought conditions so for all the downsides of being in drought, poor water quality isn’t generally one of them. See our Clary Lake Water Monitoring Data page for more info.
I’m jumping the gun just a wee bit posting this today because there’s an off chance that it might rain a wee bit more… if it does I’ll update the post.
6/01/2021: Revised rainfall totals.