
May 2020
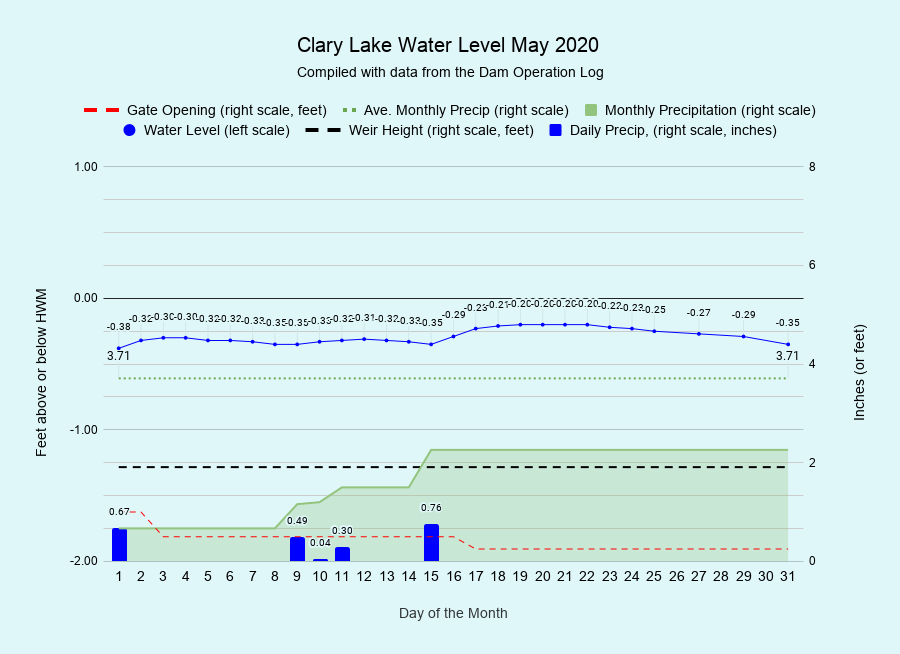
I have archived the May 2020 Water Level Chart (at left). The most notable thing about May was how stable the water level was, hovering right around the top of the dam and varying only a little more than 2 inches (0.18 feet) over the course of the entire month. This was by design of course. We started the month at the low of 150.79 feet, hit a high of 150.97 feet on the 22nd, and ended the month at 150.82 feet, only a fraction of an inch higher than we started. This was by design of course: the WLO specifies that after ice out in the Spring we should raise the lake to it’s “full capacity” and keep it as close to that level as possible through the end of July. We consider the lake is at “full capacity” when the water is lapping at the top of the dam, despite the fact that the elevation of the “High Water Mark” is roughly 3 inches higher; we obviously can’t be expected to maintain a lake level where water is running over the top of the dam.
Rainfall for May at 2.26 inches was way below the average for the month of 3.71 inches. However, because of the excess rain we received in April, at 18.4 inches for the year so far, we’re still 1.25 inches above normal for this date. That said, we haven’t received any measurable precipitation since the 15th of May and it looks like the dry trend will continue into June. We will adjust the outflows as necessary to try and maintain the lake at its current “full capacity” through the end of June at which time minimum flows drop to 1.9 cfs.
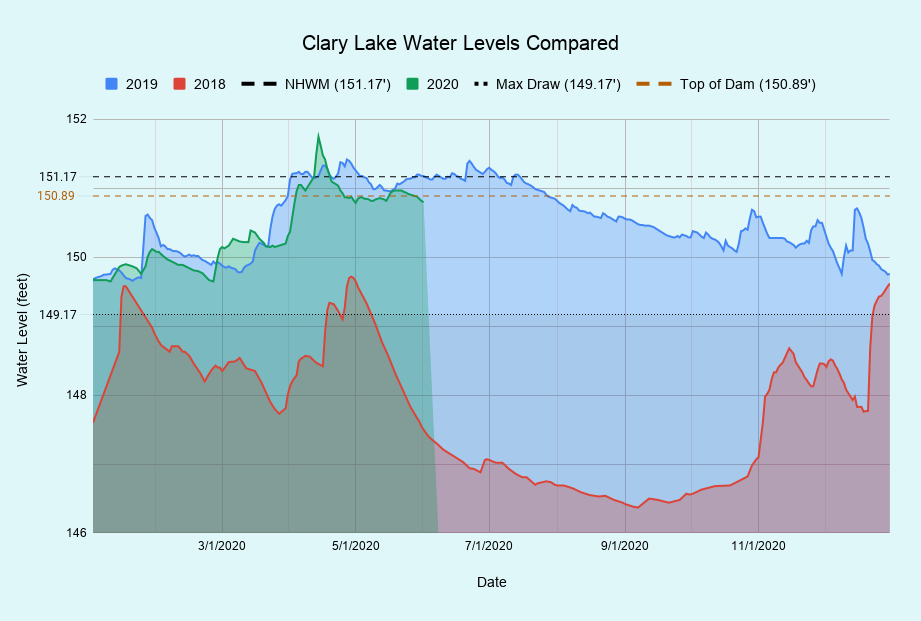 I’ve also added my new favorite chart (at left) to the Current Water Level Charts page. It’s a comparison of lake water levels for 2018, 2019, and 2020 and it’s updated automatically every time we record a water level measurement in the Dam Operation Log (you’ll find it on the Compare sheet). Also shown on the chart are lines depicting the HWM (151.17 feet), the low spot on the top of the dam (150.89 feet) where water first starts to overtop, and the theoretical maximum drawdown level of 2 feet below the HWM (149.17 feet). Initially it was going to be a one-time chart comparing water levels for the last year Pleasant Pond Mill owned the dam (2018) and the first year we owned the dam (2019), but then adding the 2020 water level to the chart was just too easy… where will it end?