
May 2019
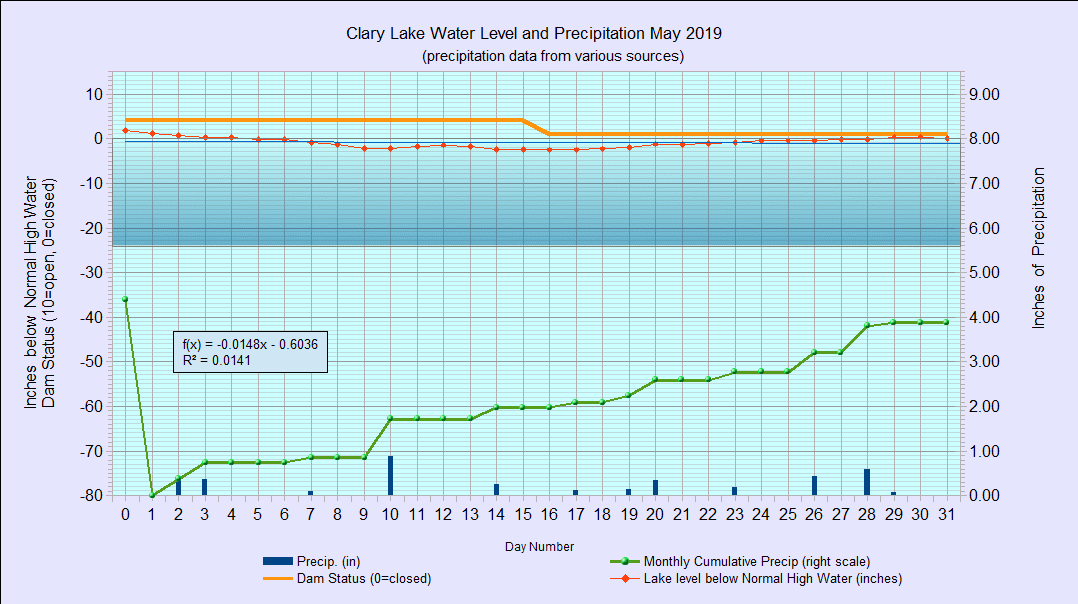
I have archived the May 2019 Water Level Chart (at left). The most notable thing about this chart is that it shows the lake level hovered around the Normal High Water Mark for the entire month, something that hasn’t happened since last month 🙂 More to the point, this is the last in this hand-made series of water level charts that I’ll be producing. I’ve been threatening to stop making these charts for a while, but old habits are hard to break. This time I’m really done. I started 8 years ago in January 2012 at the start of our long water level crisis. The introduction of the new Dam Operation Log however with its own automatically generated charts and graphs has made these traditional charts a duplicated (and wasted) effort. I have better things to do now and I just can’t justify the time and effort to continue making them. Since starting recording water level measurements in December 2011, I’ve made 2700 individual water level measurements and posted 101 Monthly water level charts. It’s the end of an era, and about time!
The Current Water Level Charts page will remain but with a new look and sporting new automatically-generated charts and graphs from the Dam Operations Log.
Finally, it was a wet month. We received 3.88 inches of rain for the month, slightly more than the average for May. For the year at 15.96″ which is right about where we’re supposed to be.