March 2021
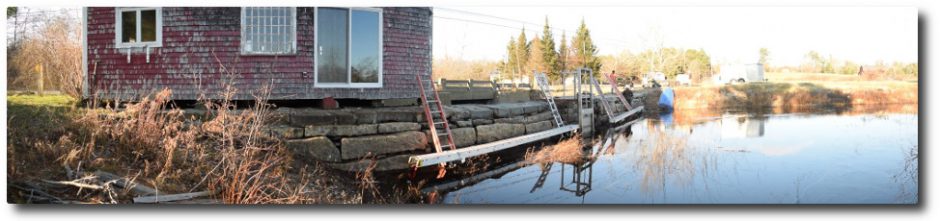
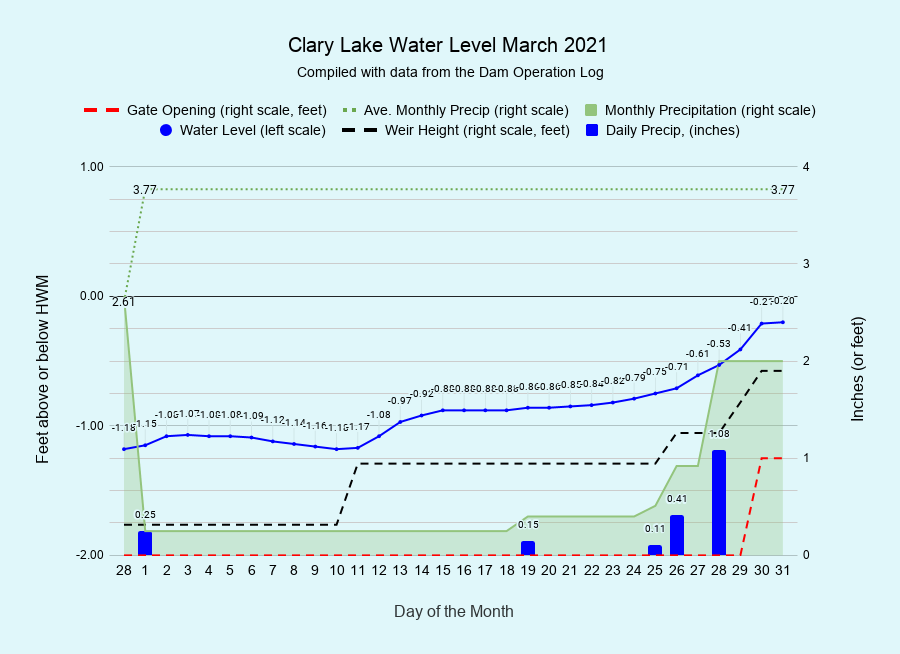
I have archived the March 2021 Water Level Chart (at left). Precipitation was again slow to accumulate in March and we ended the month with only 2.00 inches of rain, well below the monthly average of 3.77 inches. Despite the lack of snow pack and the lack of rain, we did succeed in filling the lake before the end of the month, and on pretty much the same date as last year. We did this by adding one or two stop logs, gradually raising the lake level (the black dashed line on the chart represents the height of stop logs in the weir). The dam’s gate was closed for the entire month and was only opened 1 foot on the 30th in anticipation of a significant rain event on expected on April 1st, no fooling! Filling the lake in the spring is made easier when there is more water to work with; we were able to do it this spring largely at the expense of meeting the minimum flow requirement. We started the month with the lake level down -1.15 feet below the HWM and ended up on March 31st with the lake at -0.20 feet below the HWM with a little water running over the dam. The ice went out on March 29th.
An indication of the effect that the lack of precipitation this winter has had on Clary Lake is evidenced by the “Retention Time” or “Residence Time” which is a measure in days of how long a drop of water entering the lake will spend in the lake before finding its way to the outlet. It is the inverse of the “Flushing Rate” which is how many times per year the entire lake volume is changed out. For example, if a lake’s flushing rate is 1.0 (meaning it exchanges all it’s water once a year) then the retention time is going to be 1 year = 365 days. If the flushing rate is 2.0 (meaning the lake exchanges all it’s water twice a year) then the time a drop of water will spend in the lake before leaving is going to be 365 / 2 = or half a year or about 182 days.
Clary Lake’s published flushing rate is 1.81 X meaning it completely exchanges it’s full volume 1.81 times per year, which is higher than many Maine lakes but by no means the highest. A flushing rate of 1.81 x would indicate a retention time of approximately 202 days. In actuality, the flushing rate we’ve been able to calculate from the actual outflows measured at the dam was 2.58 in 2019 (retention time of 141 days) and 2.30 in 2020 (retention time of 159 days). We’re still investigating why the measured values are so much higher than the published value, but one obvious conclusion is that there is considerably more runoff into Clary Lake than that which was assumed in coming up with the established figure. This could be due to less permeable soil (i.e., more clay) which would result in more water running off the watershed and less soaking into the ground.
Here’s a table of flushing rates for some Maine Lakes:
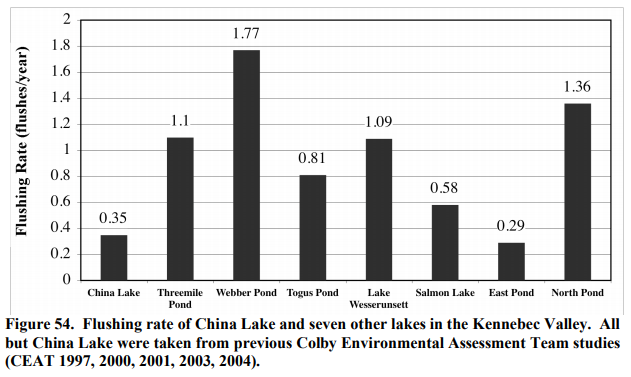
As a general rule (but not a hard and fast one), lakes with higher flushing rates and shorter residence times typically experience higher Phosphorus loads than lakes with lower flushing rates and higher residence times. This may sound counter intuitive but there is science to back it up. This is why many lakes (including Clary Lake) tend to have clearer water (indicating less Phosphorus and hence less algae) during summers with less than normal amounts of rainfall. Since runoff is a major means of introducing Phosphorus into lakes, less rainfall means less runoff means less Phosphorus entering the lake.
Flushing rates and residence times for lakes are typically calculated from average annual rainfall, general watershed characteristics, and lake volumes. When measuring actual outflows as we are doing, one has to wait till the end of the year to come up with final values for retention time and flushing rate. However, we can garner useful information by looking at these values as outflows accumulate throughout the year. For example, last year on April 1st the accumulated outflows from Clary Lake were 5458 acre-feet of water which indicates a retention time of 122 days. For comparison, this April 1st the value is less than half of that, or only 2563 acre-feet corresponding to a retention time of 257 days. That is a HUGE disparity in outflows from one year to the next and it could have profound implications for Clary Lake’s water quality in 2021. Our Water Quality Monitoring activities are set to start up again later this month. It will be interesting to see what our data shows this year!
Here’s a video of a Zoom meeting I attended last month put on by the Lake Stewards of Maine on “Everything That You Might Want to Know About Lake Flushing Rates” featuring Maine Department of Environmental Protection’s Jeff Dennis. Mr. Dennis has 50 years of experience with the DEP and is now head of the Watershed Management unit and developer of the phosphorus methodology in lake watersheds. To say he knows his material is an understatement. It was an incredibly informative program. You might find it interesting!
Looking for more information about flushing rates and retention times? Here are a couple of great articles:
Thank you for your insightful posts. While I rarely respond, each and every post you provide is enjoyed to the max. Stay safe.
Bill
Well thank you Bill. I see part of my role as a Steward of Clary Lake is to educate people (as I educate myself) about the lake and what makes it tick. Sometimes it is as simple as posting a picture of a loon, or a sunset. Sometimes it can get pretty technical.