March 2020
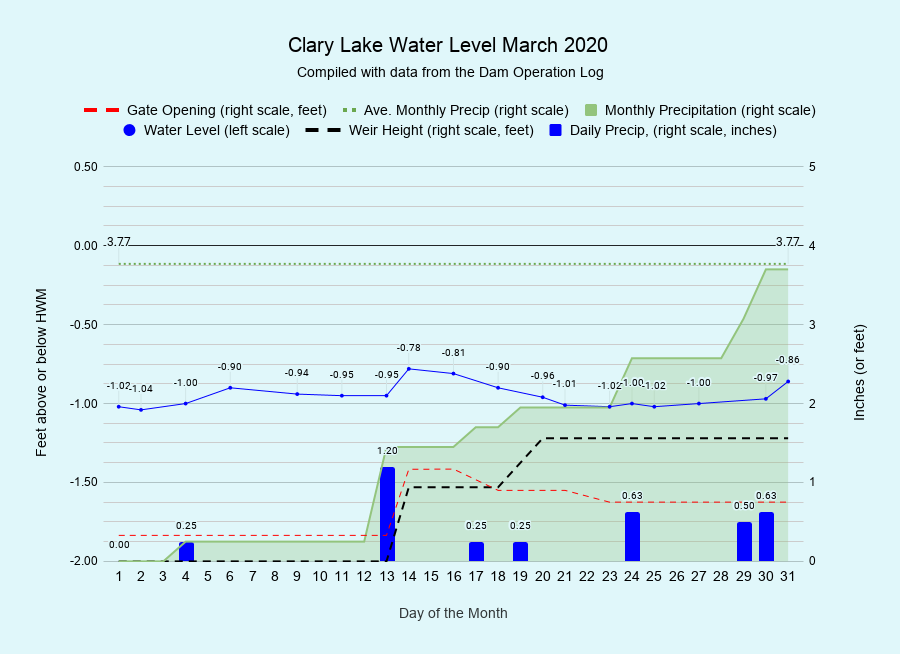
I have archived the March 2020 Water Level Chart (at left) which for what it’s worth was labeled “Clary Lake Water Level February 2020” for the entire month of March due to an oversight on my part. Hope nobody was confused about what month it really was! The remarkable thing the March water level chart reflects is the relatively stable water level that lasted through the whole month, hovering right around 1 foot below the HWM for most of the month. Normally, long about the middle of March precipitation and rising temperatures cause the snow to start melting, and runoff starts to increase which usually more or less coincides with the change in minimum flows from the wintertime rate of 11.3 cfs to the springtime rate of 35.9 cfs. It’s about mid-March that we start to install some stop logs in the weir to start raising the lake level while at the same time opening the gate to produce the higher outflows required by a the change in minimum flows. This year however there wasn’t any snow to melt so that big charge of runoff that filled the lake to the brim last March didn’t occur this year. Spring dam management can be tricky, we’re both trying to raise the lake level at the same time we’re required to release more water. If there’s enough runoff, doing both is not a problem. If there’s not enough runoff, we can’t do both and something has to give. What gives is the minimum flows: we’re only required to release the minimum flows or inflows, whichever is less.
At 3.70 inches, precipitation for the month was just shy of normal (3.77 inches). For the year to date we’re 0.32 inches above normal, mostly thanks to above average precipitation in February. This all bodes well for groundwater supplies going into spring.
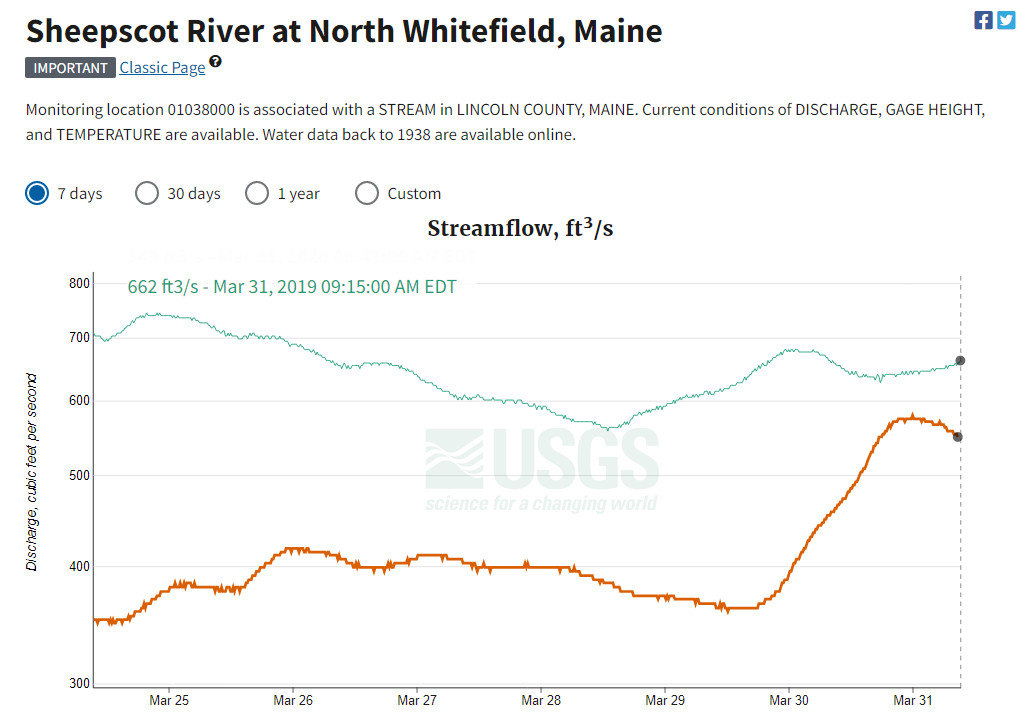 That there is a lot less water than usual sloshing around our watershed this spring despite a normal amount of rain is evident in this chart from the USGS Sheepscot River Gage site which shows Sheepscot River flows for this year (the brown line) and last year (the turquoise line) for the period March 24th to March 31st. As you can see from the chart, there was a lot more water flowing down the Sheepscot last spring than this spring. Keep in mind that Clary Lake contributes roughly 10% of the flows observed at the gaging station. All this really means is that it’s just going to take a little longer to fill Clary Lake to the its full capacity. Last spring we had more water than we knew what to do with. This spring, not so much. As of March 31st, we were still 0.86 feet below the HWM. I expect the lake to reach it’s full capacity by mid-April.
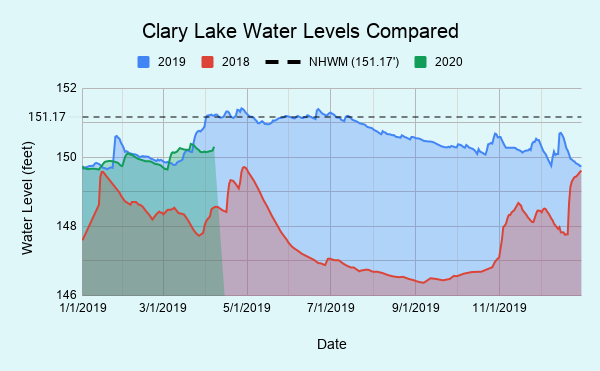 The chart at left shows an interesting way to look at the difference between this spring and last, and for that matter, the difference between 2018 and 2019.