Clary Transparency
Kelsie French and I resumed our water quality monitoring efforts for 2022 on Saturday May 14th, a little later than originally planned due to circumstances which all seemingly conspired to keep us off the lake. We’re back in the saddle now however and plan to visit Clary’s deepest spot to collect data every couple of weeks this season.
On May 14th the water quality was good with low particulates and pretty high transparency (4.20m or 13.8 feet) for this time of year, likely due to the lack of rainfall so far in May. Generally transparency in Clary Lake is improving (note the rising red trend line on the Clary Transparency chart above). Spring runoff usually introduces sediment into the water column which reduces transparency. What was also rather unusual was the surface water temperature of 22.1° C (71.8° F). That is roughly 7.5°C higher that the average for this date. On 5/16/2021 it was 15.8°C; on 6/06/2020 it was 15.0°C; on 5/11/2019 it was 12.7°C; on 5/12/2018 it was 15.3°C; on 5/12/2017 it was 12.2°C; on 5/20/2016 it was 15.8°C; on 5/14/2015 it was 15.5°C. The average of those temps is 14.6°C. This makes me wonder what the summer high water temperature will be! We could be looking at a record. The highest surface water temperature we’ve seen is 84.2°F in August 2019.
The DO (dissolved oxygen) profile was interesting as well with oxygen levels increasing from the surface more-or-less “saturated” level of 9.1 mg/l (milligrams per liter) to 10.6 mg/l at 3 meters depth. Thereafter as the depth increased the oxygen level fell off, bottoming out at 5.0 mg/l at 8 meters with a temperature of 11.7°C (later this summer the DO at the bottom of the lake will be 0, or close to it). This isn’t the usual spring profile we’re used to seeing on Clary Lake. Normally the temperature and DO readings are more uniform from top to bottom, before the lake begins to stratify.
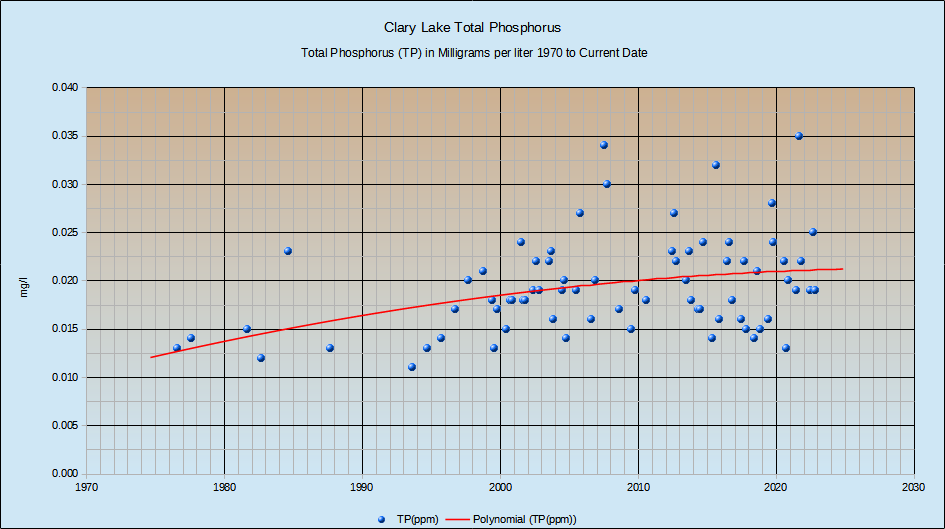
Clary Total Phosphorus
The real key to water quality is Total Phosphorus (TP) content, the lower the better. Think of Phosphorus as plant (algae) food. The more Phosphorus, the more algae growth. As you can see from the chart at left, the TP trend (the red line) in recent years has been gradually improving though last summer we recorded the highest TP reading ever. The primary source of Phosphorus in Maine lakes is sediment from runoff and it is likely that the high TP reading last August was due in large part to the 9″ of rain we received in July. It also follows that dry summers are usually better for lake water quality because runoff is minimized. We’ll take a water sample for Total Phosphorus testing next time during our next water monitoring session. We like to test for Phosphorus 3 times per year.
You can keep track of our Water Quality Monitoring activities on our Clary Lake Water Monitoring Data page.