
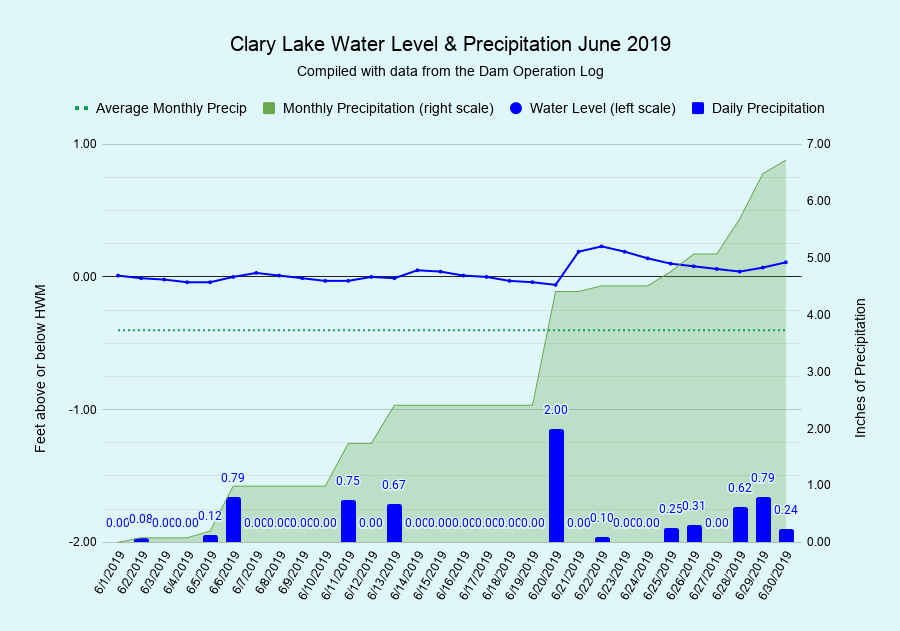
 I have archived the June 2019 Water Level Chart (at left). The most notable thing about this chart is that it shows we received 6.72″ of rain in June which has got to a record of some sort. As a result, the lake level has remained very close to or slightly above the HWM elevation of 151.17 feet with water flowing over the top of the dam for the entire month. In fact, water has been flowing over the top of the dam since April 1st, which is quite unusual. Average rainfall for June is “only” 3.73 inches and we exceeded that amount by almost exactly 3 inches. This puts us going into summer 1.8 inches ahead of average precipitation for this date. We expect the lake level to gradually drop over the next 2 months, assuming precipitation returns to something more like normal.
Minimum Flows drop today to 1.9 cubic feet per second (cfs), the lowest outflow rate of the year. Outflows will remain at this level through September 15th when they go up to 3.5 cfs.
I’m liking the new water level chart pictured above. What I like most about it is I’ve spent exactly NO TIME uploading daily updates as the charts are generated dynamically by Google. That said, I’m still tweaking the design.