
July 2021
I have archived the July 2021 Water Level Chart (at left). And just like that, the drought was over. The dry conditions that have plagued us since the beginning of the year have been effectively wiped out in one month due to the exceptional amount of rainfall we received in July. At the beginning of the month we were 6.78 inches shy of rainfall for the year. Then over the course of the month we received a total of 9 inches of rain! As of the end of the month we’re shy only 1.33 inches of the average of 24.42 inches for this date. Of course, there’s no guarantee that the drought will stay gone, but at least for now we can relax. It does appear that mid-to-late summer and fall drought conditions are the new normal. Time will tell.
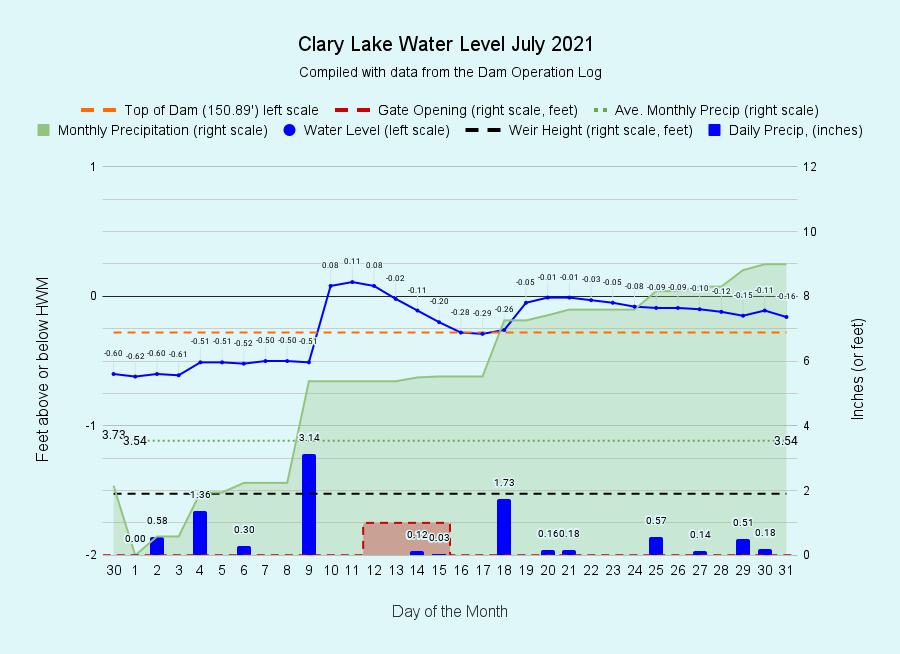
 The chart at left show the rainfall for the month. The biggest rain event was due to the remnants of Hurricane Elsa (see “10 July 2021: Hurricane Elsa Delivers Much Needed Rain [UPDATED]“) which skirted the Maine coastline on July 9th. This was mainly a coastal rain event with the heavy rainfall being limited to a fairly narrow band along the coast that did not extend very far inland. Because of this, much of the State of Maine remains in drought. Rainfall from Hurricane Elsa resulted in the lake level finally rising above the High Water Mark for the first time this year, an unusual condition to be sure: usually the water level peaks in early Spring due to snow melt and spring rains, but that didn’t happen this year. We opened the gate for a few days around the middle of the month to hasten the return to a more “normal” water level. That said, water has been flowing over the top of the dam for most of the last two thirds of the month which is most certainly NOT a “normal” condition during the summer months.
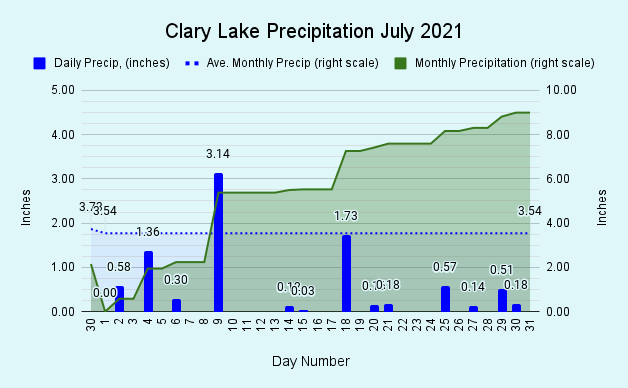
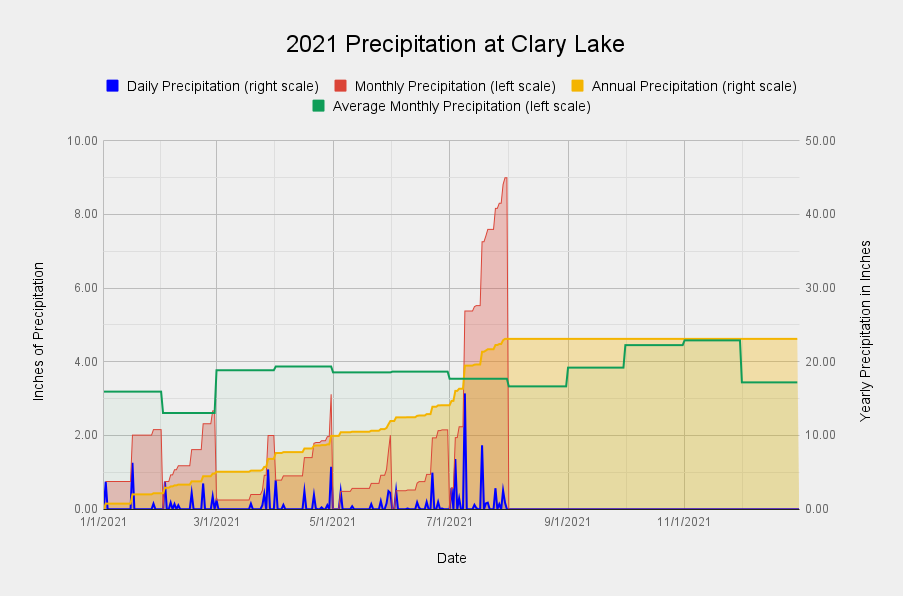 This chart shows our precipitation for the year to date. The green line shows the average rainfall for each month and the red area shows the actual precipitation received. Of the first 6 months of the year, February was the only month to reach the average precipitation with precipitation in January, March, April, May, and June all falling well short of average. Then July happened, and the water deficit was (almost) wiped out in one month.
![]() It remains to be seen what the effect of the drought conditions we’ve seen for the first 6 months of the year followed by very heavy July rains will have on Clary Lake water quality. It appears so far that our water quality has remained good, but the heavy rains in July undoubtedly introduced Phosphorus into the lake which will surely lead to increased algae growth later this Summer and early Fall. Whether this increased algae growth will rise to the level of an algal bloom remains to be seen. Our last secchi disk reading (a measure of lake water transparency) on July 27th was 3.65 meters (12 feet) which is about average for this time of year. However, algae growth tends to increase in late summer and early fall with the lake turnover, so it really is too soon to tell what’s going to happen. Kelsie French and I will be taking our second water sample of the season for Phosphorus testing during our next Water Quality Monitoring session in early August. We typically take 3 water samples per year for Phosphorus testing.
It remains to be seen what the effect of the drought conditions we’ve seen for the first 6 months of the year followed by very heavy July rains will have on Clary Lake water quality. It appears so far that our water quality has remained good, but the heavy rains in July undoubtedly introduced Phosphorus into the lake which will surely lead to increased algae growth later this Summer and early Fall. Whether this increased algae growth will rise to the level of an algal bloom remains to be seen. Our last secchi disk reading (a measure of lake water transparency) on July 27th was 3.65 meters (12 feet) which is about average for this time of year. However, algae growth tends to increase in late summer and early fall with the lake turnover, so it really is too soon to tell what’s going to happen. Kelsie French and I will be taking our second water sample of the season for Phosphorus testing during our next Water Quality Monitoring session in early August. We typically take 3 water samples per year for Phosphorus testing.
It will be interesting to see how this year’s rainfall (or lack thereof) will affect our water quality. Clary’s current Retention Time of 281 days (which corresponds to a Flushing Rate of about 0.76) is almost TWICE what it was at this time last year meaning that water is staying in the lake almost twice as long before leaving the lake as it was last year at this time. Exactly how this will impact out water quality remains to be seen but GENERALLY speaking, higher retention times and lower flushing rates as we’re seeing in 2021 tend to favor improved water quality, but this is not a hard and fast rule. If you want to know more about Retention Time and Flushing Rates and what they mean, see the “March 2021 Water Level Chart Archived” post.