July 2015
I’ve archived the July 2015 water level chart. The most notable thing about it is that it shows the lake level fell to 60″ below the top of the dam on the 9th of the month and remained well below that mark for the rest of the month. It has never been this low for this long. And no wonder given how little rain we’ve received this year: as of July 31st we have received a total of only 15.29″ of precipitation since the beginning of the year. Last year on the same date we had received 29.74″ or almost twice as much. The lake level also fell to a 4 year record low of 62.64″ on July 18th (see 21 July 2015: A new high in lows“). It has since fallen even lower than that, ending the month at 63.48″ on the end of the month.
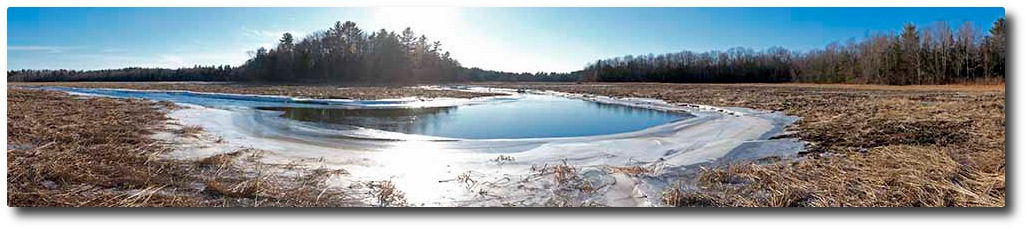
It’s been so dry this year and especially this past month that when it does rain, very little of it runs off into the lake because most of the precipitation that falls on the ground is being soaked up. This fact, in combination with the topography of the exposed shoreline around the lake, results in a runoff multiplier less than 1x meaning that an inch of rain will bring the lake up something less than an inch. This doesn’t really make sense until until you realize that as the lake level rises it also spreads out, increasing the area of the lake. In other words, when it rains the lake gets bigger, not so much deeper. We’ve seen this phenomena before. How cruel is that?
Because of the berm at the outlet of the lake, very little water is actually leaving the lake now and flowing down the channel to the dam; most of the water that you see flowing out through the dam these days is seeping out of the ground in the meadow area itself, which is quite wet, and also coming in from Clark’s Meadow Brook. As a result, most of the ongoing daily drop in water level (about 1/4″ per day) is due to evaporation.