[April 2022] With all the attention on Clary Lake ice this spring, it seems fitting to post this article I’ve been working on for awhile, yet another in our Continuing Education Series, based on the premise that informed people make better Lake Stewards! This post is on Ice Berms and Pressure Ridges and the science behind them and will be added under the Programs & Education menu heading.
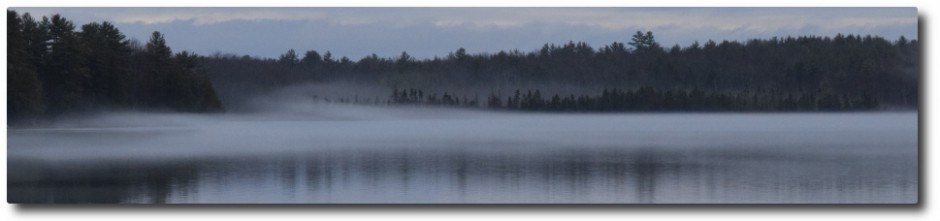
 I received a few inquiries about ice berms and pressure ridges in response to my post about February water levels so I thought I’d provide a little more information about these interesting phenomena and the science behind them. Imagine the forces at work that were responsible for the buckled ice in the photo at left! First we need to learn more about how water changes and what happens to it as its temperature changes.
Water becomes more dense (heavier) as its temperature drops, causing it to sink below warmer water: cold water sinks and warm water rises. We all know this much from going swimming and encountering that cold layer of water 4-5 feet below the surface. As its temperature drops, water continues to become more dense and continues sinking below warmer water until it gets down to about 39° F. 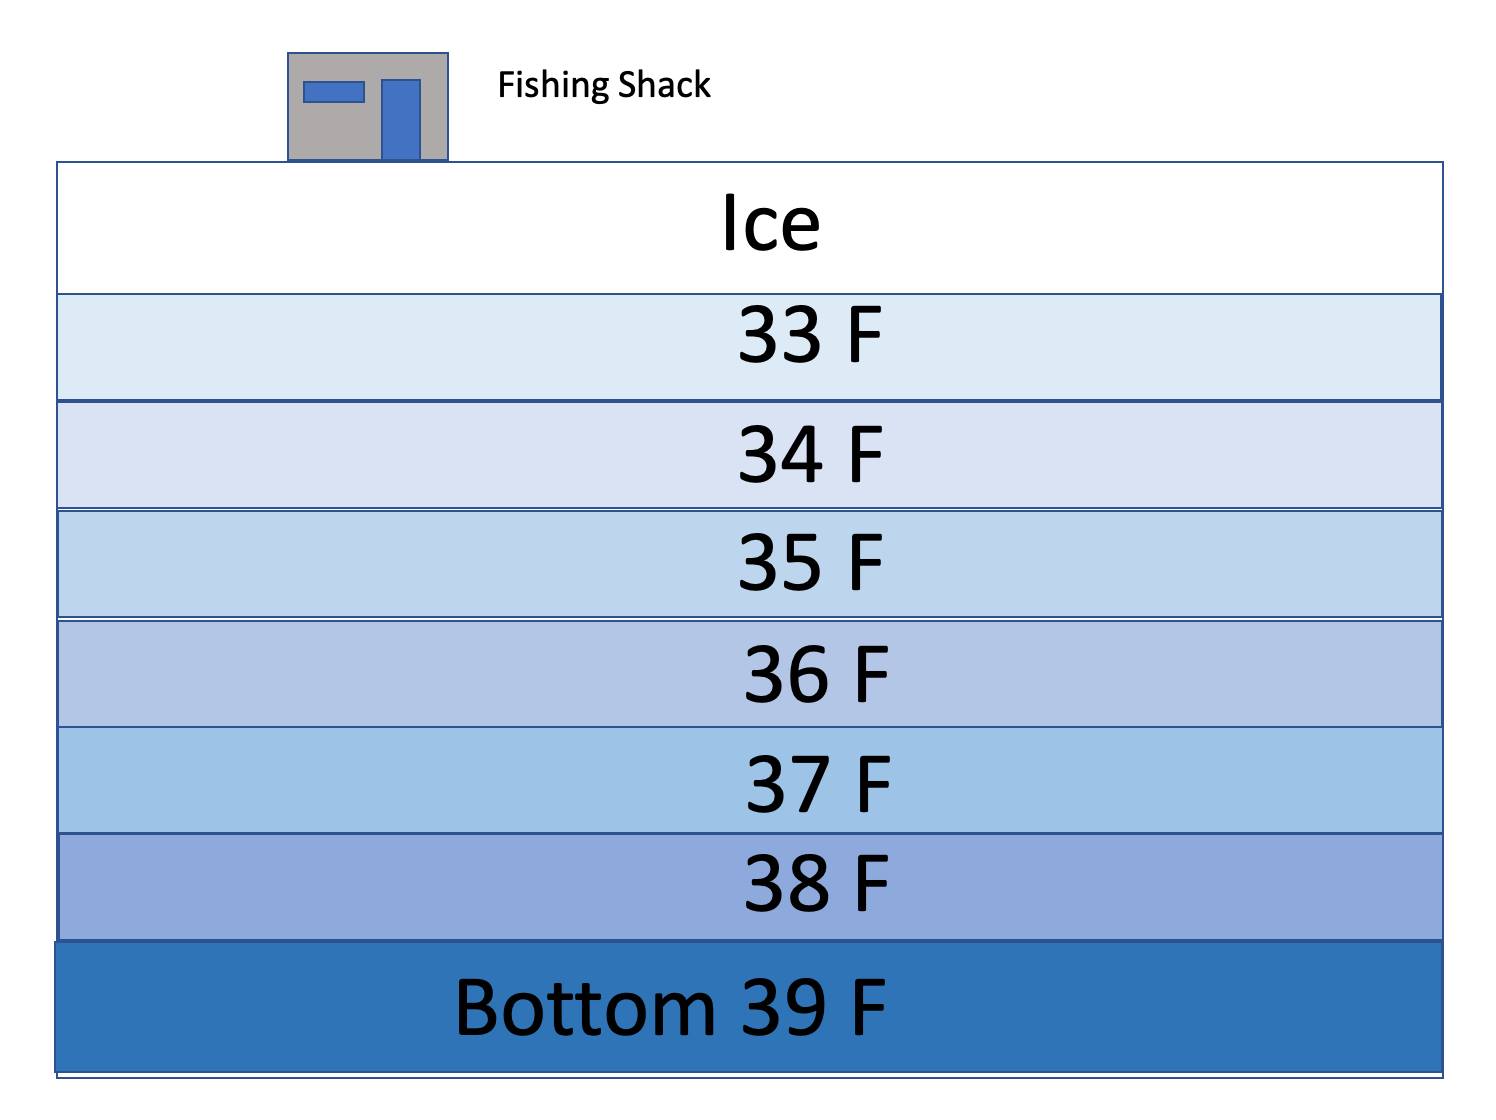 Then something unexpected happens: as the water cools, the molecular motion continues to slow down and as the water starts to assume the crystalline lattice structure that is ice, the distance between the molecules actually increases. The freezing water, rather than continuing to become denser, actually begins to expand, becoming less dense, causing it to float (it is this expansion as it freezes that ends up breaking water pipes). By the time water reaches its freezing temperature of 32° F (0° C) and changes to ice, it has expanded approximately 9% from its maximum density and a complete inversion from the usual summertime temperature stratification takes place. In the winter when the lake is ice covered, the coldest water is right under the ice and the temperature rises as depth increases so the warmest (and densest) water is at the bottom of the lake. This is completely opposite of what we see in the summer time with the warmest water at the surface and the coldest water at the bottom.
 Now here’s where it gets interesting! Once ice is formed and its initial expansion has taken place, it doesn’t continue to expand as it gets colder, the process reverses and it actually starts to shrink. The cracks you see forming in the lake ice and the “belly aching” sound we hear on cold winter nights is not due to the release of built up pressure within the ice, but rather it is due to the release of tension within it: what you’re seeing and hearing is the ice literally ripping itself apart as it shrinks. The colder ice gets, the more it shrinks. As the ice sheet shrinks, water is exposed around the edges which freezes, slowly making the ice sheet larger. Similarly, as ice warms up it will expand again until it reaches its melting point (0° C or 32° F). The rate at which ice shrinks (as it gets colder) or expands (as it gets warmer) is referred to as its coefficient of expansion: ice shrinks (or expands) 50 x 10-6 meters / ° C (i.e., 0.00005 meters per degree centigrade change in temperature). Let’s plug some numbers into that using Clary Lake as an example.
 Clary Lake is approximately 1.5 miles (2.42 Km or 2415 meters) long from the southeast end down by the boat launch to the northwest end where the outlet channel starts but only 0.23 miles (0.367 Km or 366 m) wide at its narrowest spot between the Hodsdon & Grant points. Let’s say that after an extended period of crisp sub-zero nights the ice sheet on Clary is at a temperature of 0°F; over the course of the next week the daytime temperature rises to 40°F and overnight temperatures only drop to freezing. After a week of this the ice sheet on the lake has warmed up from 0°F to 25°F (a change of 25°F or 13.9°C): The overall length of the ice sheet is going to expand:
0.00005 x 13.9° x 2415 m = 1.67 m = 5.50 ft.
At its narrowest spot between the two points however it will expand much less:
0.00005 x 13.9° x 366 m = 0.25 m = 0.83 ft.
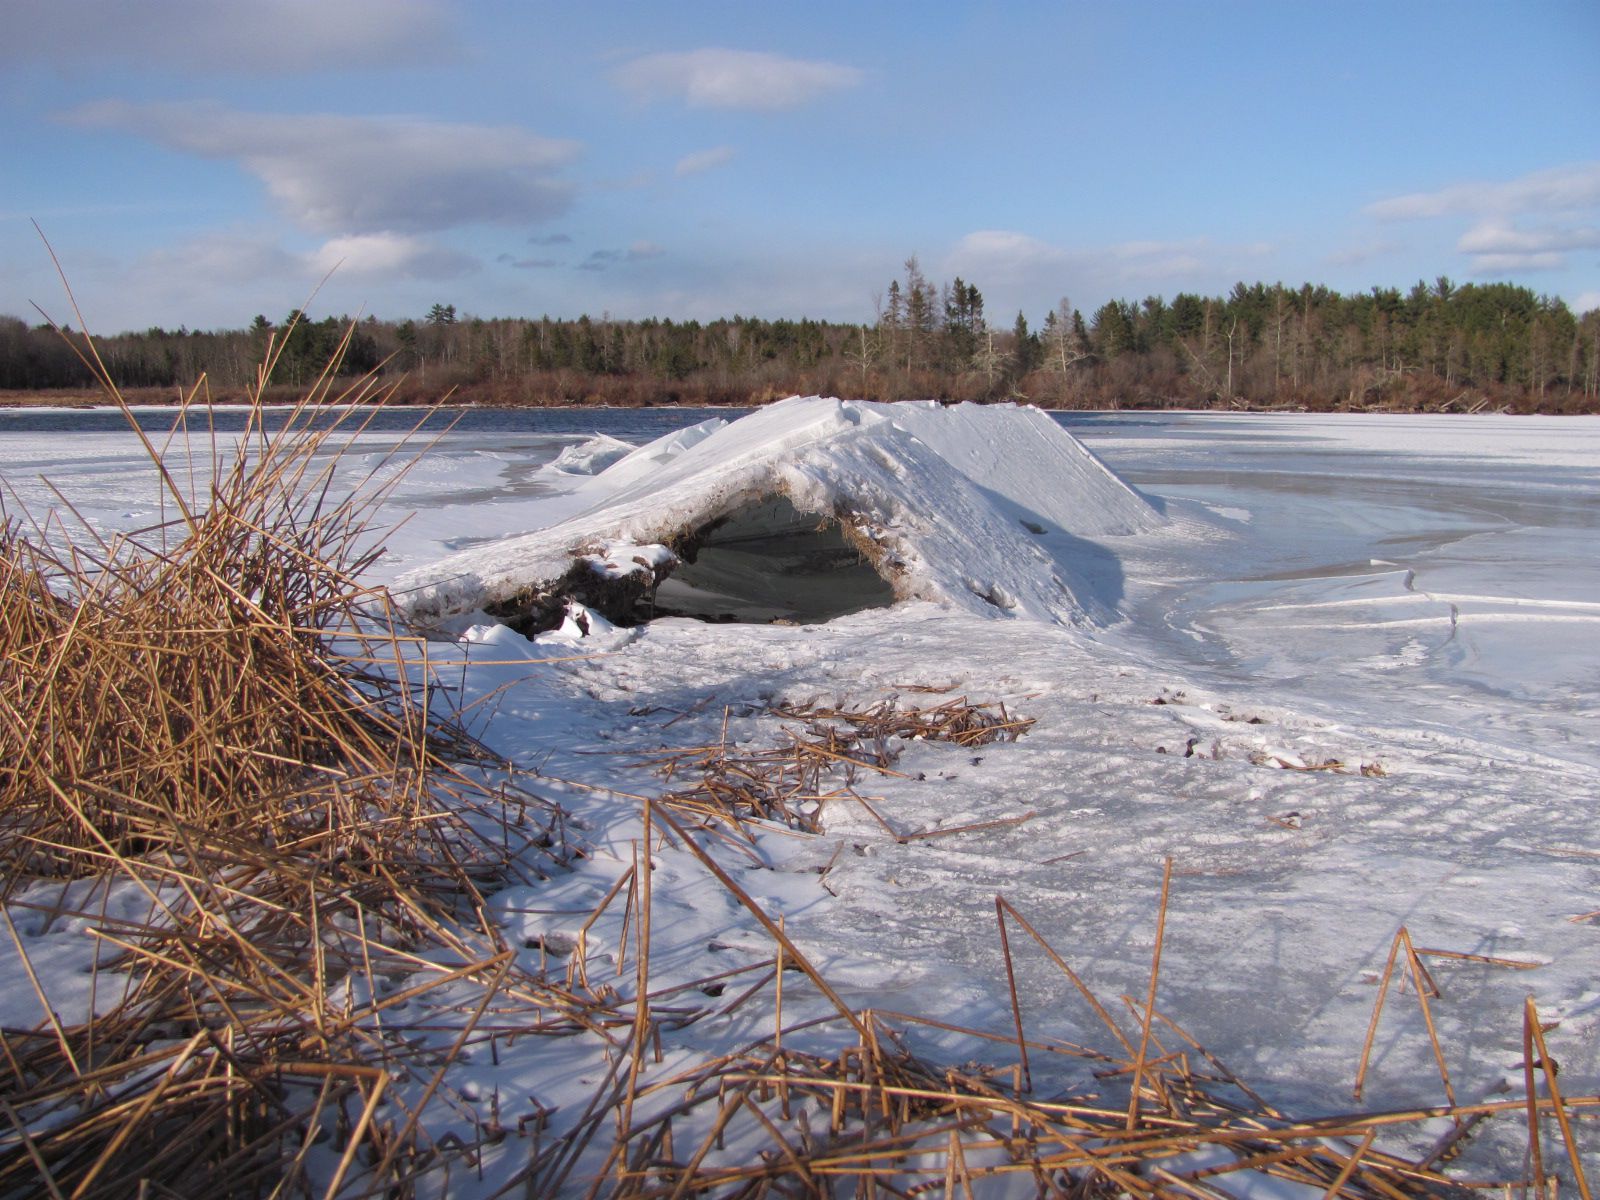
 As you can see the expanse of ice in play has a big role in how much expansion we’ll see which explains why we don’t see evidence of ice expansion everywhere around the lake. Keep in mind that the ice sheet is going to expand in all directions (or at least it will exert expansive force in all directions) so you’d not necessarily see 5.5 feet of actual movement at one end of the lake or the other. In any case, even a couple of feet of lateral expansion of the ice sheet would be enough to account for the pressure ridge pictured at the top of the page! In the above example, between the Hodsdon & Grant points, overall expansion might be 0.83 feet but you’d probably only see 1/2 of that (perhaps 4 or 5 inches) on either side of the lake.
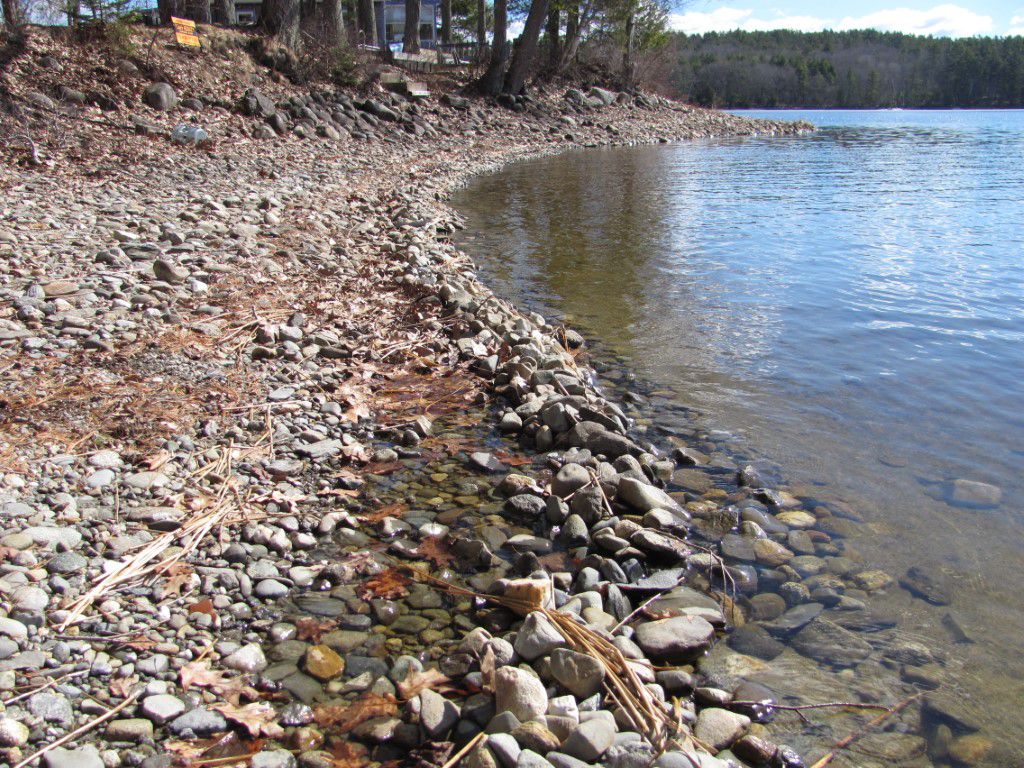 Once the ice sheet starts warming up and expanding, it can no longer comfortably fit within the confines of the shore line that originally contained it, and it starts pushing back. If the ice is pushing solidly against a shoreline, it can exert many tons of pressure per square inch, and something will have to give: if the ice is thin or honeycombed it might just buckle or crumble, but if it is thick and solid enough, it will be the shoreline that gets pushed around. This explains how every spring it seems like the rocks on our shoreline have been rearranged! Some areas are going to be more susceptible to ice damage than others because of their character, or location, and depending on the lake level at the time, evidence of this epic winter battle between ice and shoreline might or might not be noticeable come spring when the lake level is at its highest.
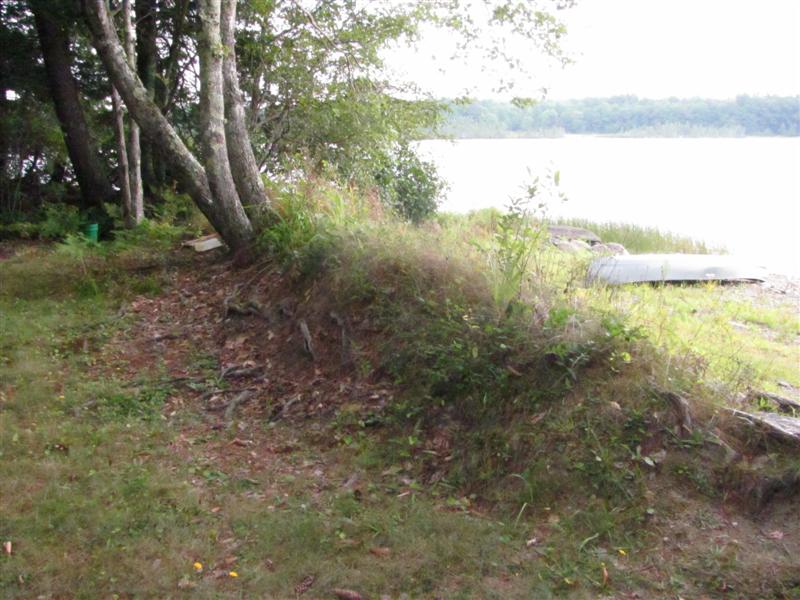
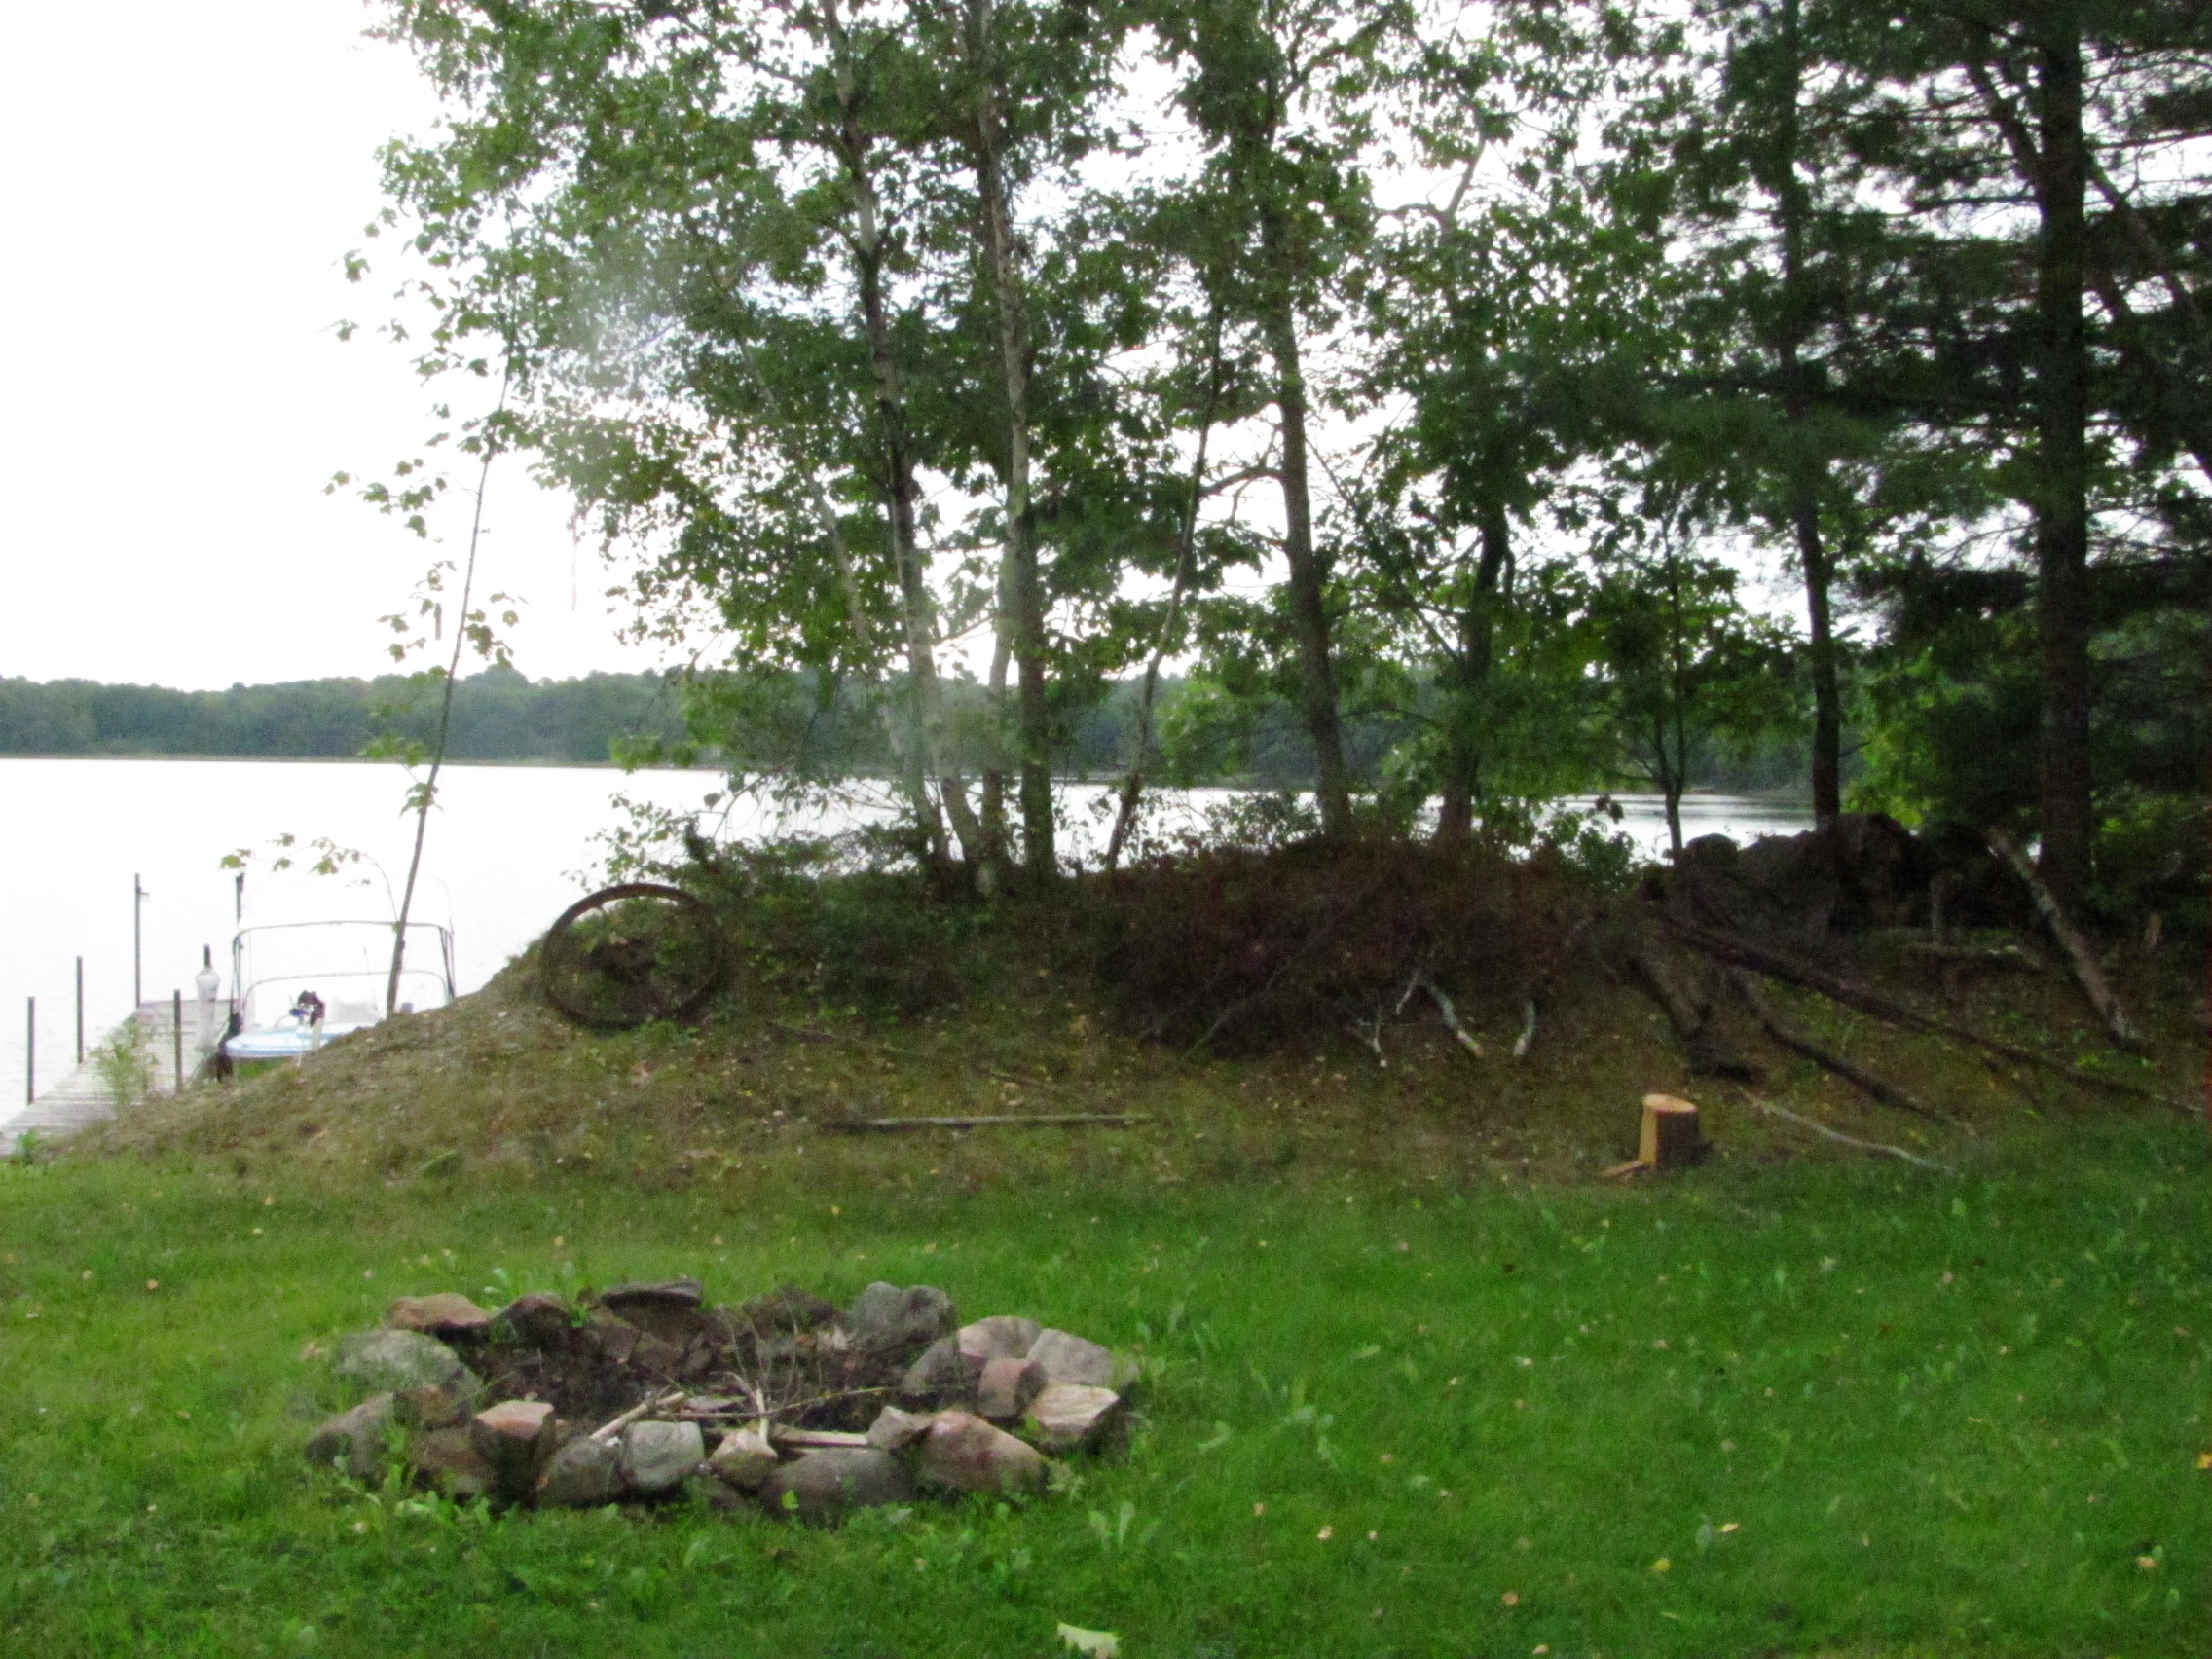
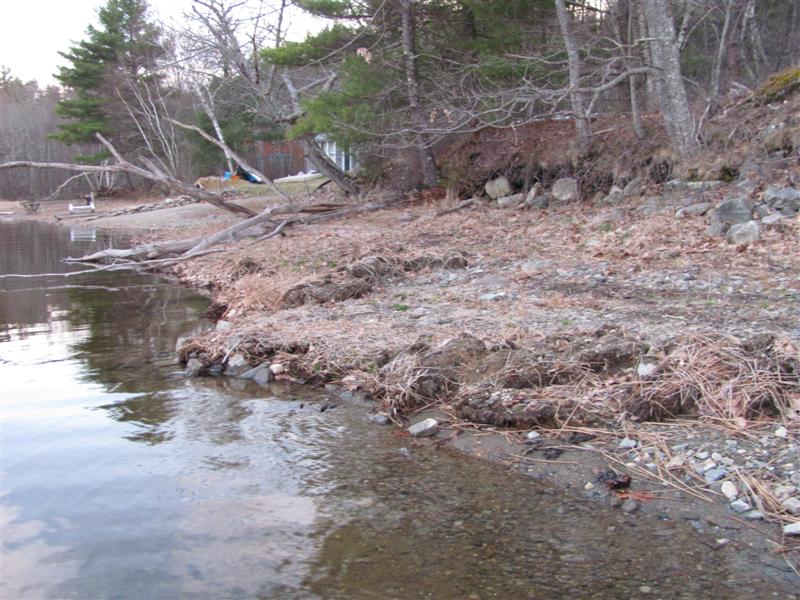
In conclusion: expanding and contracting ice over many decades, pushing and pulling on the shoreline around the lake, piling up rocks, knocking down trees, and scouring ledges has formed our current day shoreline. The evidence is everywhere if you just look for it. The existence of the ice berms pictured above is clear evidence that historically high winter water levels over the years have been the norm, not the exception.
Published 8 April 2022