August 2019
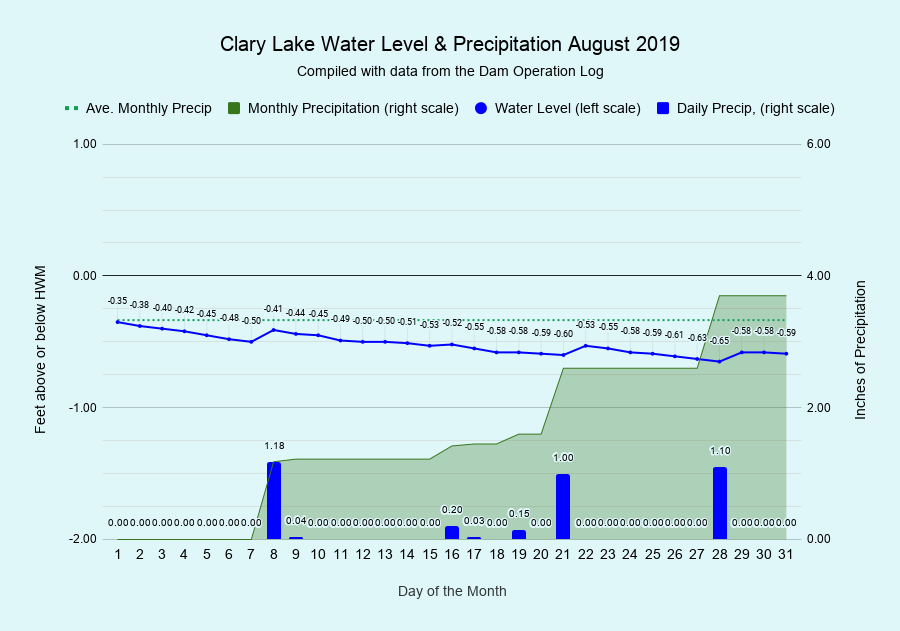
I have archived the August 2019 Water Level Chart (at left). The most notable thing about this chart is how much rain we received during what has traditionally been the driest month of the year. August started out dry, but it wasn’t long before we broke the Summer drought trend started in July. We received a total of 3.70 inches or 0.37 inches more than the average for August. This rainfall helped keep the lake level right about where we wanted it all month. For the year to date we’re 1 inch above average.
Minimum flows for the period from July 1st until September 15th are 1.9 cfs (cubic feet per second) which is about how much leaks through the dam. Minimum flows rise to 3.5 cfs on September 16th. The minimum flows vary throughout the year as follows:
- 11.3 cfs between January 1 and March 15;
- 35.9 between March 16 and May 15;
- 8.3 cfs between May 16 and June 30;
- 1.9 cfs between July 1 and September 15;
- 3.5 cfs between September 16 and November 15; and
- 15.5 cfs between November 16 and December 31.
I’m still tweaking the monthly water level chart from time to time, but don’t expect major changes. I like this one.