
August 2016
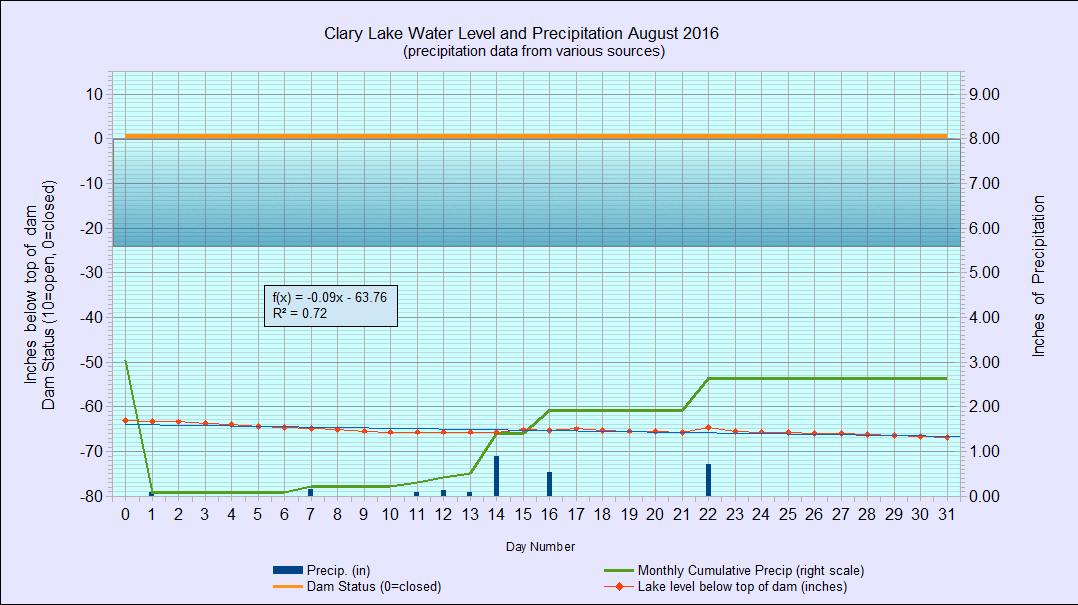
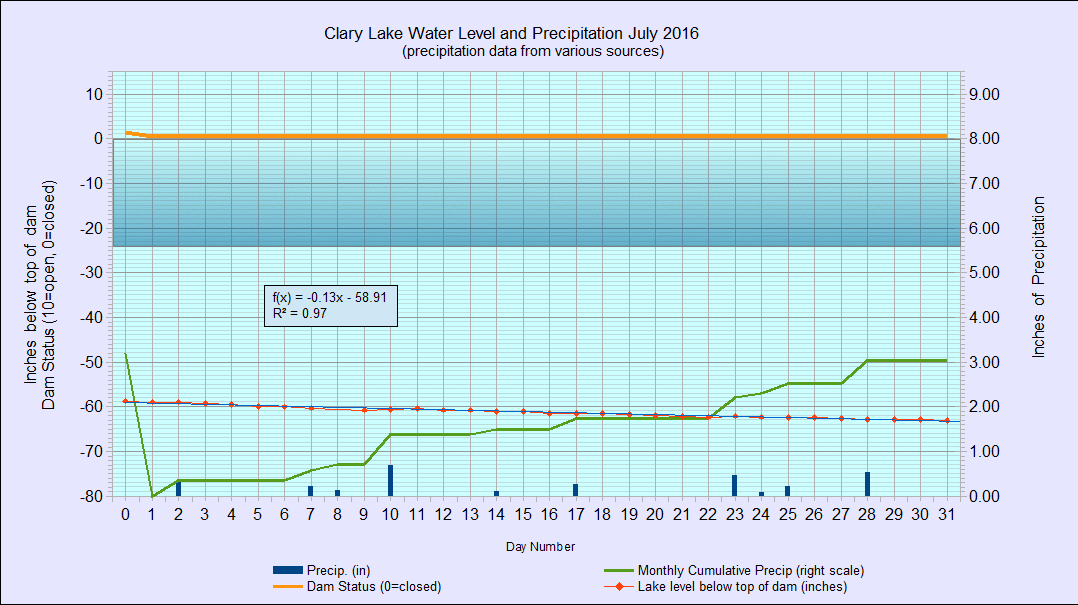
I’ve archived the August 2016 Water Level Chart (at left). The most notable feature of the August chart is that it looks identical to the July 2016 chart except the water level is lower. The month started with the lake level at 63.24″ below the top of the dam and after a slow but steady decline of about 0.12″ per day, ended the month at a historic low level of -66.84″.
Rainfall for the month at 2.64″ was about 2/3 of an inch below normal. For the year to date we’re about 2.3″ below normal, not as bad as other parts of the state but still drought conditions.
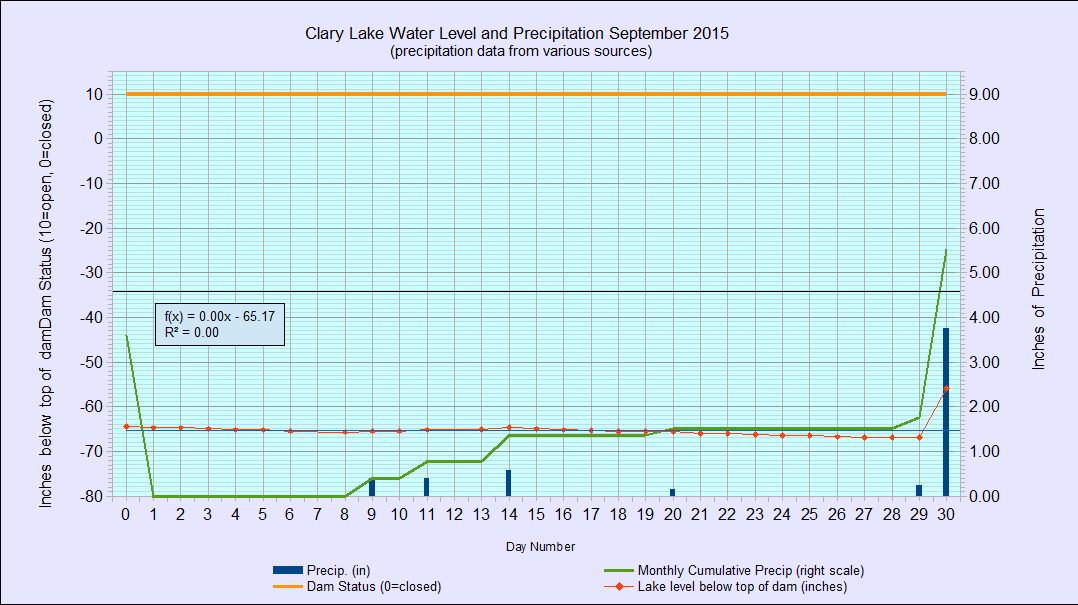
Not much else to say about the August water level chart. You’ve only seen Clary Lake this low once before, 11 months ago on September 29, 2015.
I’ve had to move my waterline twice in the last two weeks. I’m hoping I still have running water available for the holiday weekend!