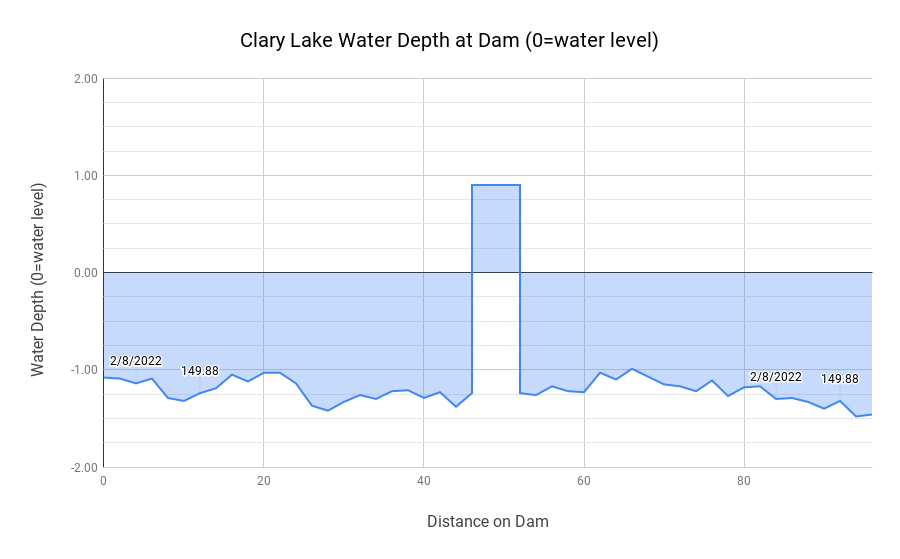
 Everyone knows I love charts (and maps!). They’re a great way of visualizing data. Sometimes my love of maps and charts takes me to some pretty strange places. Here’s an example of one of those places (at left). Every time I look at this chart I have to stop and peer at it for a moment before it makes sense. Every time. And some days it just doesn’t make sense no matter how long I stare at it. This particular chart shows the water level of Clary Lake on February 8th, 2022 and the elevation of the water line on that date is 149.88 feet, or 1.29 feet below the HWM. What this chart is actually showing us is the distance the lake surface is below the top of the dam, at any place along the top of the dam, starting at the left (0 feet) and proceeding to the right (98 feet).
We can tell the lake surface is below the top of the dam because the water depth is negative! On the far left the water surface is about 1.15 feet below the top of the dam. Waaaay over on the right side at the HIGH point of the dam, the water is almost 1.5 feet below it. The water surface is almost exactly 1 foot below the low point of the dam, located about 66 feet from the left end. Perhaps the most confusing aspect of this chart is the weir, that 5 foot wide column in the middle. What’s actually pictured is the BOTTOM of the weir (or the TOP of the stop logs which is the same thing if you stop to think about it…) which in keeping with this confusing chart is confusingly at the TOP, and the fact that it’s all blue (and positive on the left scale) indicates the lake surface is about 0.9 feet ABOVE the bottom of the weir. In other words, the lake surface is below the top of the dam but there’s still water flowing over the weir. You’re welcome.
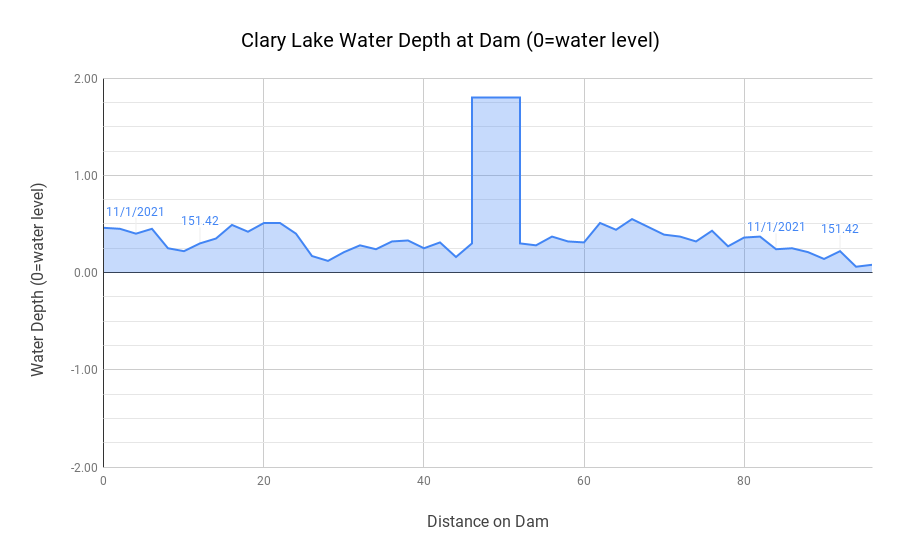 Here’s the same chart showing the water conditions this past fall, on November 1st, 2021. On this date, the lake surface was at an elevation of 151.42 feet or 0.25 feet ABOVE the high water mark. As above, this chart is showing us where the water surface is in relation to any place on the dam. In this case, we can tell the lake surface is above the top of the dam because the water depth is POSITIVE. As for the weir, there’s almost 1.8 feet of water over the bottom of it. That’s VERY positive in deed! If you’ve been paying attention, what should be obvious now is that these charts aren’t really showing us the water level at all, they’re showing us where the top of the dam (and the bottom of the weir) is in relation to the lake’s surface. If the top of the dam is in positive territory, the lake level is above the dam. If the top of the dam is in negative territory, the lake level is below the top of the dam. Just think of the weir as a part of the top of the dam that is 2 feet lower than most of the rest of it. Again, you’re welcome.
Some day this chart will assume its rightful place, discarded and forgotten in the dustbin of Clary Lake history but for now this black sheep of charts is alive and well and still sharing space in the Clary Dam Operation Log and in my head, along with its more normal brother and sister charts.