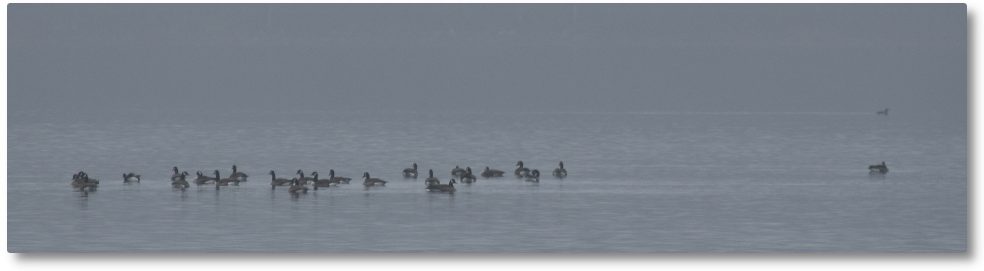
And so we come to the end of another month, and for that matter, another year. I’ve just posted the 2014 chart (below) in the 2014 Water Level Charts album. This makes the third full year that I’ve been recording Clary Lake water levels. You’ll notice that last winter I stopped making water level measurements in early February and didn’t resume until April

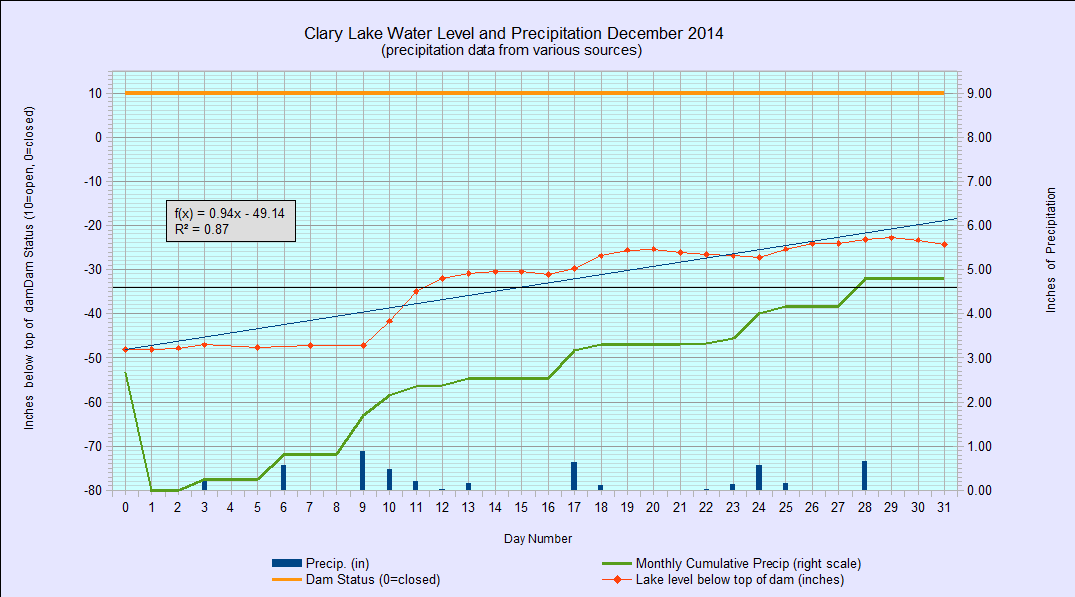 The December 2014 chart (at left) is interesting. The rainfall we received back on the 9th of the month and over the next few days, though only 1.78″ in total was enough to bring the lake level up fully 16″ and to within an inch of 2 feet below the top of the dam for a runoff multiplier of 9 x (1 inch of rain = 9 inch rise) due to partly melting snow but mostly just because the ground was frozen. In other words, little if any rainfall soaked into the ground. It all ran off (the runoff multiplier during summer months is generally more like 4 x). Subsequent additional rainfall brought the lake level to 22″ below the top of the dam, right about where it would be this time of year if the Water Level Order being adhered to.
I’d also like to take this opportunity to wish everyone a safe and happy New Year’s Eve and a happy and productive New Year. I sincerely hope that 2015 sees the Clary Lake water level order implemented, the lake level restored, and a satisfactory resolution of all the issues surrounding the Clary Lake dam, for all parties. The Clary Lake Association is diligently working to bring these things about. With your help, we will succeed.