 We’ve finally gotten around to putting current Clary Lake water monitoring data online. It’s a subset of the data collected by David Hodsdon and Jack Holland and will be updated roughly every 2 weeks from early spring through late fall or as often as David and Jack get around to it. What’s online now includes all the data from 2012 and what’s been collected so far in 2013. That little thumbnail at left is what a secchi disk looks like- it’s used to measure the transparency of the water.
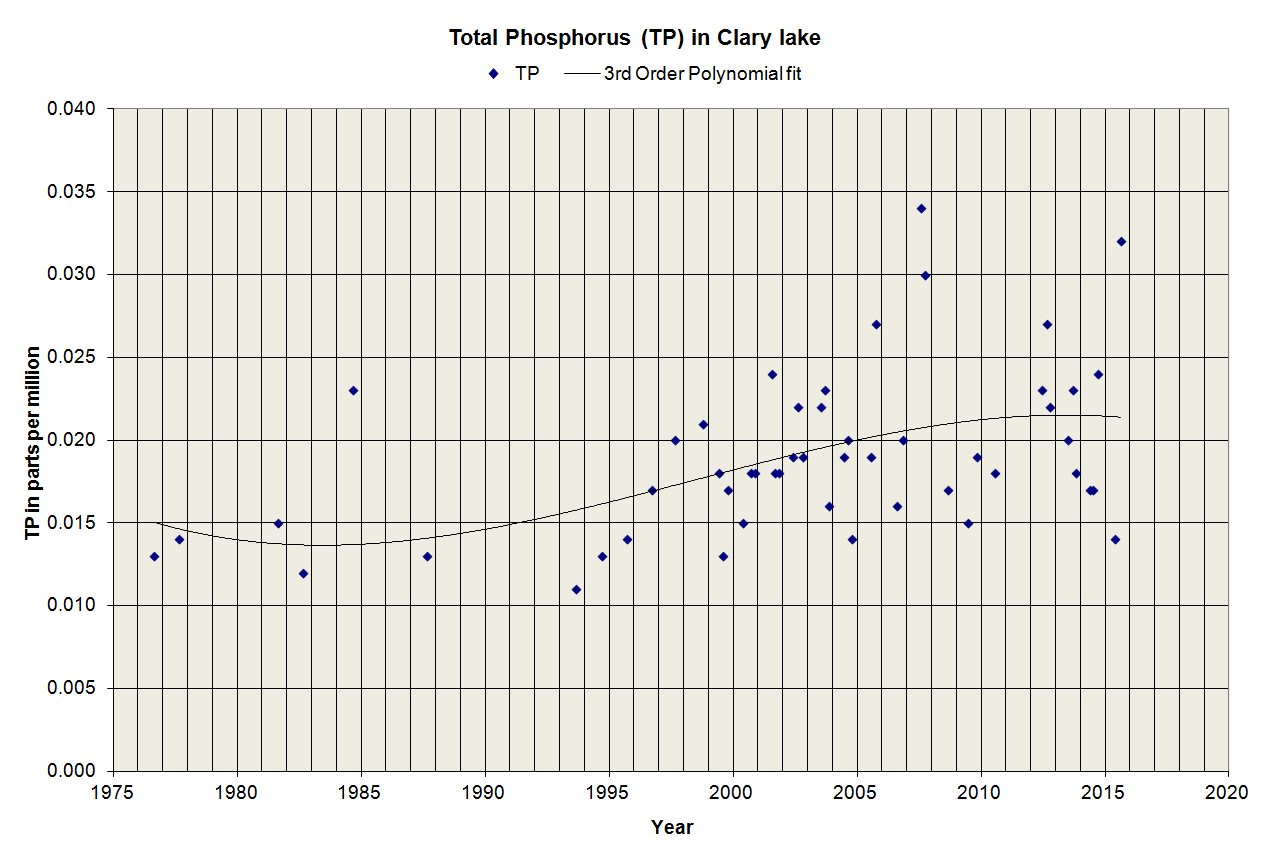
I hope to get some historical data online soon; there’s quite a bit of it. David has been collecting water quality data on Clary Lake since 1975, Jack Holland since about 2001. Both are certified volunteer water quality monitors. Here’s a typical data sheet from a data collection session and here are 3 charts based on the collected data. Graphing the data is helpful because it allows you to see trends in the data that aren’t necessarily obvious from just looking at it. One disturbing trend evident from the secchi disk chart is that the transparency of the lake water has deteriorated markedly in recent years. This trend also coincides with the increase in phosphorus evident from the Total Phosphorus chart. We’ll be talking more about these trends in the near future.


Last spring I accompanied David and Jack on one of their regular water quality monitoring sessions and have put together a short photo gallery of that session: “Our Water Quality Monitors at Work“.