
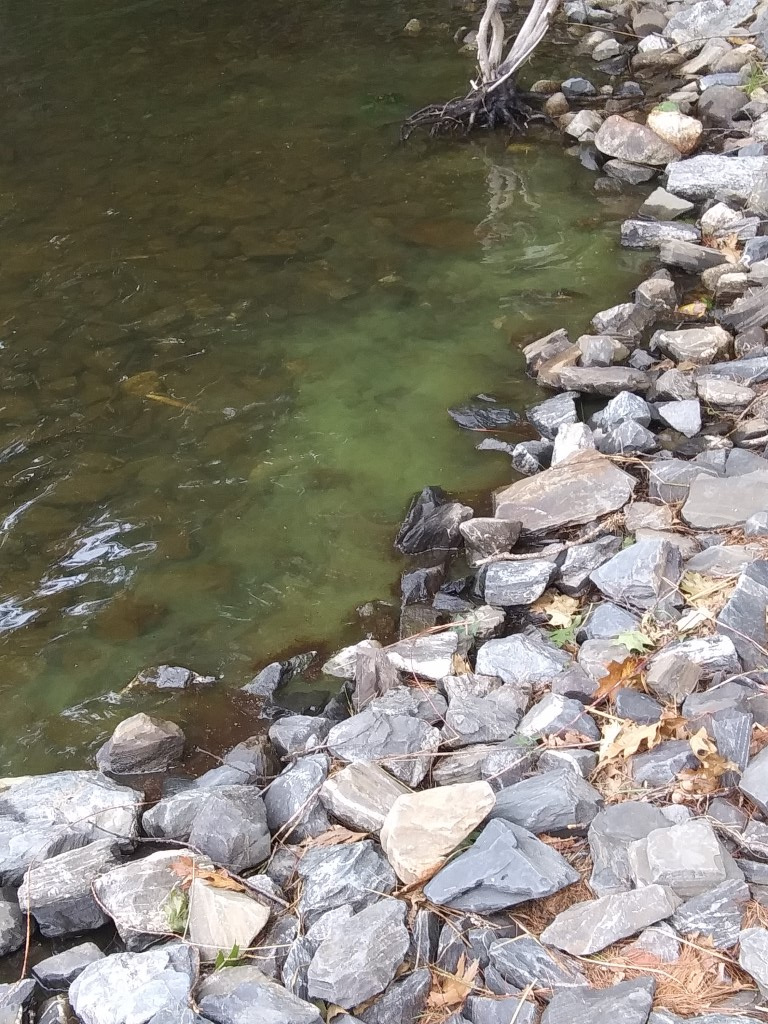
 You might have noticed that Clary’s water has been getting cloudy. Sadly, it’s not just your imagination! Last Saturday afternoon Kelsie French and I went out for our twice-monthly water quality monitoring session and we recorded a secchi disk reading (a measure of water transparency) of 2.38m (7.8 feet), down from 3.15m (10.33 feet) two weeks earlier. The next day, Dave Knight who was on CBI duty at the State boat launch, took the picture at left and sent it to me. I was not surprised. What the picture shows is dead blue/green algae (cyanobacteria) which floats to the surface where it’s pushed around by wind and waves. Eventually it sinks to the bottom and decomposes. Less than an hour after he took this picture, the green stuff was gone. Technically, an algae bloom is defined as a secchi disk reading of 2m or less, though in my opinion, anything below 3 meters (9.8 feet) puts you in bloom territory and we’ve been there for a few weeks now. A little dead blue/green algae washes up every year and it’s nothing to be too concerned about, but this year we’re likely to see a good deal more than usual in the next few weeks. In other words, our water transparency is likely to deteriorate further before it starts to clear up later this fall. We’ll be taking another water sample for Phosphorus testing in two weeks and will be monitoring lake transparency weekly until this algae growth winds down. Keep an eye on our Water Quality Data page.
![]() As you can see from the transparency chart at far left, the last time we had a secchi disk reading as low or lower that last weekend’s was in July 2015. I can’t explain why we’re seeing such algae growth NOW other than pure chance that the conditions necessary to promote algae growth have all finally occurred together: 1) for the first time in a while we had a good sized rain storm in late August (1.8″ on 8/22) that was heavy enough to generate some runoff, which introduced Phosphorus in to the lake; 2) with outflows down to a bare minimum, our retention rate is high (currently about 207 days) and correspondingly our flushing rate is relatively low (1.2X, average is 1.8X). Taken all together, this means is that water that enters Clary Lake stays in Clary Lake for a relatively long time and there’s plenty of plant food (phosphorus) to stimulate algae growth (you can see this flow data on our Operation Log). Add to the mix lots of sunlight i.e., bright sunny days (algae requires sunlight to grow) and you’ve got perfect conditions for algae growth. Contrary to popular belief, warm water is not a requirement for algae growth; most algae blooms in fact occur in the fall when lake water temperatures are falling. In the fall, lakes “turn over” and the water at the bottom of the lake which is rich in Phosphorus mixes with the upper layers where sunlight can reach, and the algae go crazy.
As you can see from the transparency chart at far left, the last time we had a secchi disk reading as low or lower that last weekend’s was in July 2015. I can’t explain why we’re seeing such algae growth NOW other than pure chance that the conditions necessary to promote algae growth have all finally occurred together: 1) for the first time in a while we had a good sized rain storm in late August (1.8″ on 8/22) that was heavy enough to generate some runoff, which introduced Phosphorus in to the lake; 2) with outflows down to a bare minimum, our retention rate is high (currently about 207 days) and correspondingly our flushing rate is relatively low (1.2X, average is 1.8X). Taken all together, this means is that water that enters Clary Lake stays in Clary Lake for a relatively long time and there’s plenty of plant food (phosphorus) to stimulate algae growth (you can see this flow data on our Operation Log). Add to the mix lots of sunlight i.e., bright sunny days (algae requires sunlight to grow) and you’ve got perfect conditions for algae growth. Contrary to popular belief, warm water is not a requirement for algae growth; most algae blooms in fact occur in the fall when lake water temperatures are falling. In the fall, lakes “turn over” and the water at the bottom of the lake which is rich in Phosphorus mixes with the upper layers where sunlight can reach, and the algae go crazy.
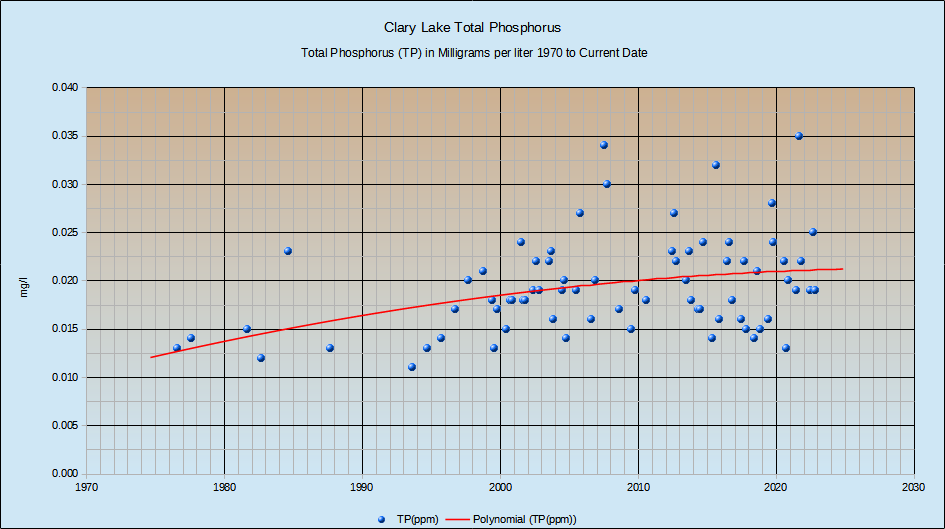 Phosphorus is the primary factor influencing algae growth. On August 5th of this year we had 0.025mg/l (milligrams per liter) of Total Phosphorus in our water which is on the high side of where we’d like to see it. The chart at left shows all our Phosphorus values back to 1976. Higher Phosphorus readings generally correspond to lower water quality and the cutoff point seems to be around 0.025mg/l; below that value there is lesser risk of having a bloom; at or above that value and we stand a higher risk of seeing an algae bloom. During our last “official” bloom in July 2015, our Phosphorus reading was 0.32 mg/l and there were other extenuating circumstances (primarily extremely low lake levels) that contributed to us having a bloom.
As you can see, there’s been a general upward trend in Phosphorus readings over the years, an alarming trend which thankfully appears to be leveling off. However, please note that from 1976 through 1998 we weren’t testing for Phosphorus ever year, and when we did test we were only taking one water sample per year, usually in August. Since 1999 we’ve been taking 3 water samples per year. So there’s a real lack of data early on and our trend line might actually look quite different if we had additional Phosphorus data from 1976 through 1998. Going forward, only more data and more time will confirm if this leveling off trend is real or a figment of the numbers.