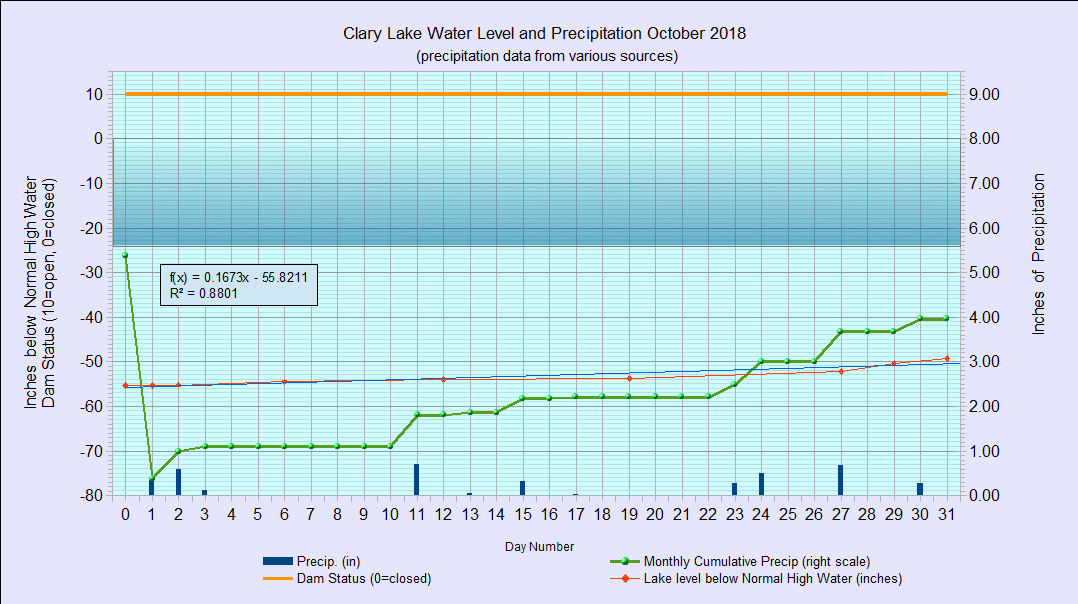
I have archived the October 2018 Water Level Chart (at left). As you can see the water level in October very gradually rose a total of only 6.12″ over the course of the month from a low of -55.32″ below the Normal High Water Line on the first day of the month to -49.20″ on the last. We received 3.96″ of rain during that period and the fact that the lake didn’t rise more is an indication of how depleted the water table has been. Average rainfall for this date is 34.30″ and we’re only at at 31.96″ or 2.34″ below normal. You’ll notice the chart shows the dam’s gate is still wide open. We’re going to leave it open until the repairs to the dam have been completed.
Clary Lake Association
Preserving and Protecting Clary Lake

