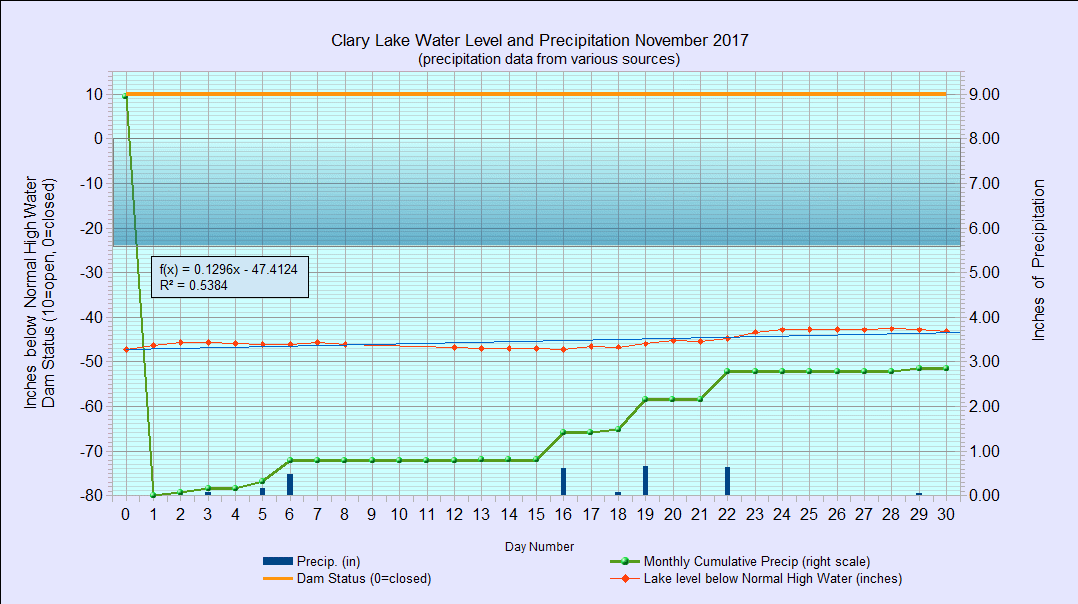
I have archived the November 2017 Water Level Chart (at left). The most notable feature of the November chart is… nothing 🙂 There is nothing particularly notable, or remarkable, about November’s water level chart. The lake level managed to rise 3.24″ over the month, ending marginally higher than it started.
Rainfall in November was well below normal but still enough, with a fully-recharged water table, to keep the lake level rising marginally. We received only 2.85″ of rain, 1.52″ less than average for November. This brings us to 35.44″ for the year which is still 3.23″ below normal for this date despite the almost 9″ of rain we received in the end of October.

