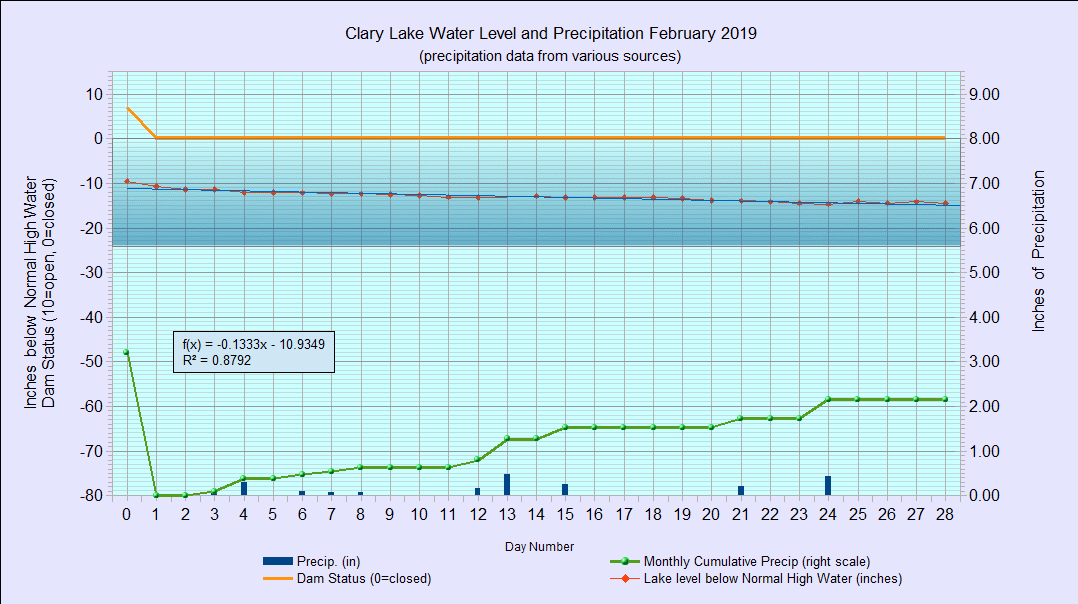
February 2019
I have archived the February 2019 Water Level Chart (at left). The most noticeable thing about this chart is it’s BORING, and how pleasant for a change not seeing rapidly fluctuating water levels! The lake level gradually dropped only 3.72″ over the course of the month from a high of -10.68″ below HWM at the start of the month to -14.40″ below the HWM at the end of it, staying pretty much right within the range we were looking for. Our goal was to keep the lake level right about 12″ to 18″ below the HWM. We didn’t have any major precipitation events: rainfall for the month of February was slightly below average with precipitation of only 2.16″ bringing us to 5.36″ for the year, slightly above the average of 5.04″ thanks to a extra wet January. We do have a reasonable snow pack developing so runoff this spring should be more than sufficient to raise the lake level up to the HWM, for the first time in over 10 years.
The dam’s gate and weir were left untouched for the month of February: the gate remained closed for the month and the weir remained wide open without any stop logs installed. We do have a supply of stop logs ready to go and will start the process of gradually raising the lake level by mid-March, perhaps sooner if the weather starts to warm up significantly and maybe later if the cold weather persists. At issue are the Minimum Flows required to maintain the downstream aquatic habitat; they are currently at 11.3 cfs (cubic feet per second) but jump to 35.9 cfs on March 16th and I want to be well on our way to filling the lake by that date.
A number of people have been viewing the Dam Operation Log which gives the lake level, weir and gate outflows, and approximate inflows along with odds and ends of other information, some interesting, some not so interesting. One particularly interesting (to me) piece of information from the log is the flushing rate: since the beginning of the year, 44% (approximately 3180 acre-feet of water) of Clary’s total volume of water has been flushed out to date. An acre foot is a measure of volume equal to an acre (43,560 square feet) of water one foot deep and Clary contains approximate 7224 acre feet of water. The average flushing rate for Clary Lake is supposedly 1.8x per year. I’m interested in seeing how close we come to that published figure, or whether we exceed it.