
December 2018
I have archived the December 2018 Water Level Chart (at left) bringing us to the end of what has turned out to be the LAST YEAR of sub-par water levels for the foreseeable future. At this time last year the lake level was 42″ below the HWM and we were waiting for Justice Billings to rule on the appeal of the Clary Lake Water Level Order while at the same time beginning to entertain the possibility of actually buying the Clary Lake dam from Paul Kelley’s bankruptcy estate. The ruling on the appeal came a few months later in February; the purchase of the dam, well that took a little longer. Looking back, what a landmark year it has been.
There are a host of “most notable” things about the December 2018 chart. I look at it and see a sequence of miracles that culminated with the repairs to the dam being completed just a few days before Christmas. In no particular order, one miracle was the slow but steady decline of the lake level from the beginning of the month; once the lake level starts rising in the fall, it rarely reverses course. The 17 days in December without any precipitation was in itself a miracle, and that alone allowed the water level to drop enough for the dam repairs to be completed. Another notable feature is the remarkable lake level rise following the receipt of 1.8″ of rain on December 21st, a scant 2 days after repairs to the dam were completed! Coupled with the closing of the gate, that single rain event brought the lake up over 18″ in 3 days, and it hasn’t stopped rising since. Finally, the chart shows the gate being closed for the first time in over 2 years.
You’ll also notice a few days ago we opened the gate a little bit- about 3″ to be exact. Since the lake is about where it’s supposed to be this time of year we wanted to slow down the lake level rise a bit as well as release a little more water to meet the need to maintain minimum flows. I’ll post more about this in the future.
We received a modest 3.03″ of rain in December which was just a little less than the December average of 3.23″. While we spent much of the summer in drought, we actually ended the year with 42.09″ of precipitation which is just a hair above average for this area so for the first time in a few years, we’re going into winter with our water table fully topped off. For that matter, we’re going into winter with the lake level about where it’s supposed to be this time of year too. Much of the yearly rainfall deficit was made up in November when we received 7.10″ of rain, which almost stopped us from completing our dam repairs.
2018
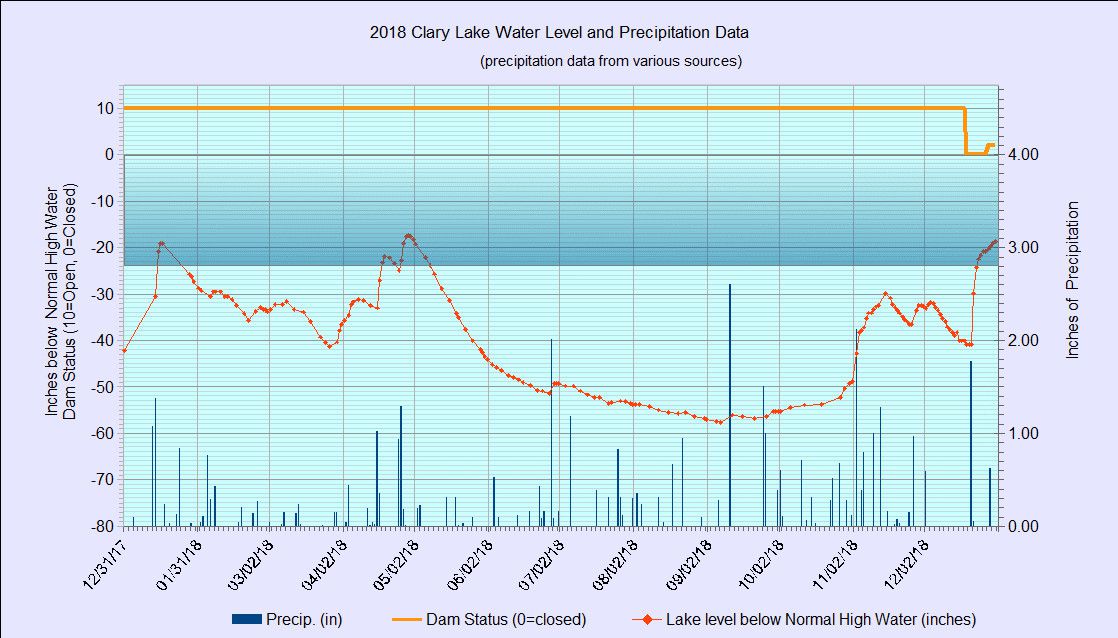
I’ve also archived the whole 2018 Water Level chart (at left) which is interesting to look at. The main thing that stands out for me is the long gradual decline in the water level over the summer. You’ll find all this past year’s charts in the 2018 Water Level Charts gallery and charts for previous years back to 2012 in the Water Level Chart Archive.