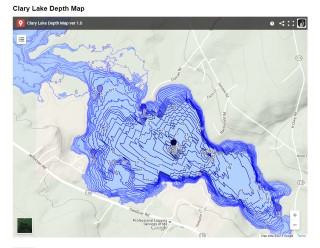
Clary Lake depth map v2.0 (click on the image to view the page)
I’ve added an updated version of the Clary Lake depth map to the site using an embedded Google Map. The page is located under the Charts & Data main menu heading and is entitled “Clary Lake Depth Map” and it’s pretty cool if I do say so myself. This new map has a contour interval of 1 foot and uses dynamically rendered depth labels so as you zoom and pan around the map the labels redraw so you can usually tell the depth of any line you’re looking at. If not you can click on any contour lines and find its depth. The depth contours are also color coded so the darker the line, the deeper it is. There are 8 color ranges, some of which are a little hard to distinguish. Click on the Legend link on the top left corner of the map to see them (if you can’t see the legend symbol, try resizing your browser window). I’ve also added a few colored dots marking rocks and ledges and plan to add a few more as time will permit. You can click on them as well to find out the depth. You can also change the map to use a satellite image instead of the standard terrain base map. Unfortunately, this can make the blue depth contour lines a little hard to see; when I have some time I’ll prepare a map with depth contours intended to be viewed on a satellite image. There are a lot of neat features available with Google Maps and I’m still learning, so expect the map to go through some changes.
If you click on the little box in the upper right corner you will open the map in Google Maps viewer and have a larger canvas to use. Even better, if you’re viewing it on a GPS enabled device such as a smart phone or tablet, your location based on your GPS will be shown on the map meaning you can take it out on the lake and see where you are in real time. I tried this out earlier today and located some underwater features, and it works great!
Now for the technical part: This depth map is based on bathymetric data supplied by the Department of Environmental Protection which they collected on September 21, 2012. All of the 0, 1, 2, 3, and 4 foot contours around the edge of the lake and in meadow areas were generated using elevations from 2 meter LIDAR data obtained from the Maine Office of GIS. LIDAR, which stands for Light Detection and Ranging, is a remote sensing method involving aircraft that use light in the form of a pulsed laser to measure ranges (variable distances) to the Earth. The 2 meter part refers to a 2 meter grid (6.6′) with an elevation at each corner. This elevation information can be used for all sorts of things, including making contour maps. The actual point spacing for the data around Clary Lake was 1.5 meters, or about 5′ and the root mean square error is only 13 cm (about 5″) meaning 95% values are that good or better. Pretty amazing mapping technology.
The LIDAR data in the vicinity of Clary Lake was flown on April 18, 2012. On that date, the elevation of the surface of the lake according to my measurements was 146.28′ or about 5.1′ below the top of the dam. The average elevation of the lake surface from the LIDAR data with minor variations is essentially the same. I was therefore able to use the LIDAR data to generate accurate contours from 0′ down to 5′ to fill in those areas where DEP was unable to collect data because of shallow/no water: those areas close to the shoreline where they couldn’t get their boat, and in the drained meadow areas around the lake. The mapping itself was done using Qgis, an open source Geographic Information System.
One thing you’ll notice: the 0′ contour corresponding to the high water mark often encompasses more area, and sometimes considerably more area, than the blue shaded water body on the base map. This is most noticeable in the great meadow at the northwest end of the lake and to a lesser extent at the southeast end by the inlet. This difference is because the boundary of the lake on the base map was digitized many years ago from aerial photographs taken who knows when, when the lake was at some level other than “full.” On the other hand, the high water mark (0′ contour) is based upon an actual elevation obtained from the above mentioned LIDAR data.
Another thing to make note of: there is a 5′ contour running the whole length of the channel from the lake all the way to the dam, it just isn’t shown.
The elevation datum used for for this depth map is NAVD88 based on the WGS 84 ellipsoid. All depths are expressed in feet below the top of the Clary Lake dam. The high water mark therefore has an an elevation of 0 feet and corresponds to a NAVD88 elevation of the top of the dam of 151.2′ which figure is based on a 2014 elevation survey conducted for DEP by CES, Inc.
It is important to remember that the depths on the map are correct ONLY when the lake is FULL i.e., when the water level is at the top of the dam which it isn’t, and likely won’t be, for a while. Currently the lake level is about 4.5′ below the top of the dam so where the map says it’s 5′ deep you’ll likely only find a half foot of water. You were warned.