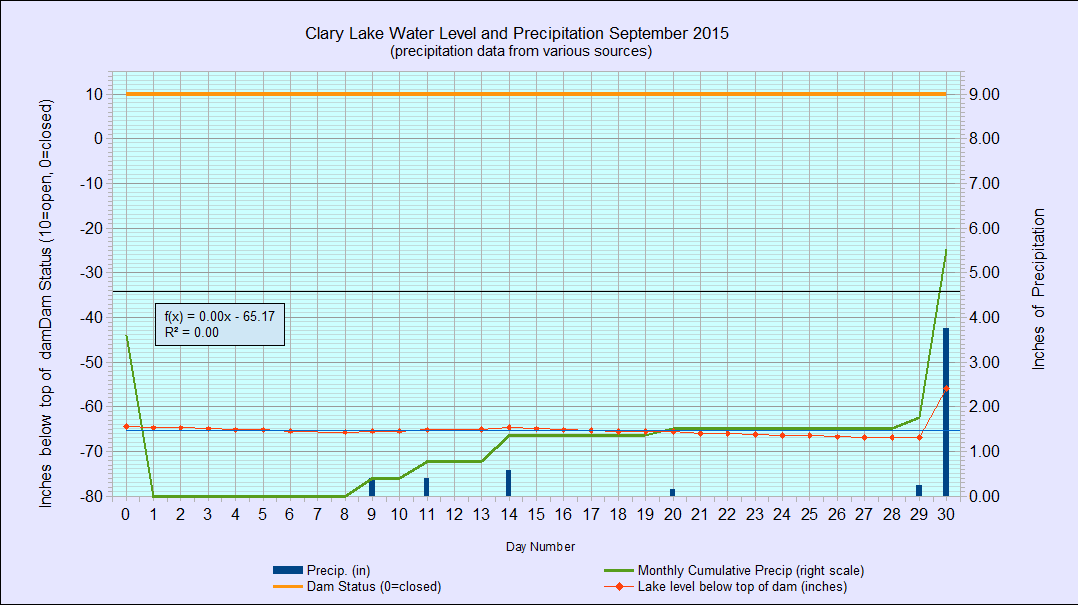
 I’ve archived the September 2015 water level chart (at left) which clearly shows the impact of the recent drought conditions. The lake level averaged -65.86″ below the top of the dam and never varying more than ±1″ from that level until the last day of the month when we received over 4″ of rain in less than 24 hours. By 7:30 PM on the 30th the rain had stopped but it was still way too windy to get an accurate measurement of the lake level though it appears it had come up about 12″. No doubt today will see an additional rise in lake level but I wouldn’t expect it to come up too much more because a lot of what would normally have run off into the lake ended up soaking into the very dry ground.
And just like that, we went from 1.52″ of rain to 5.52″ for the month. The extreme runoff has resulted in considerable lake sedimentation resulting from shore erosion and stream bed scouring. If the lake level were where it should be this time of year (between 1′ and 2′ below the top of the dam) this rain event would have had little impact on lake water quality. I shot a short video yesterday afternoon showing a flooded stream entering the lake, which I’ll post later.
