
September 2020
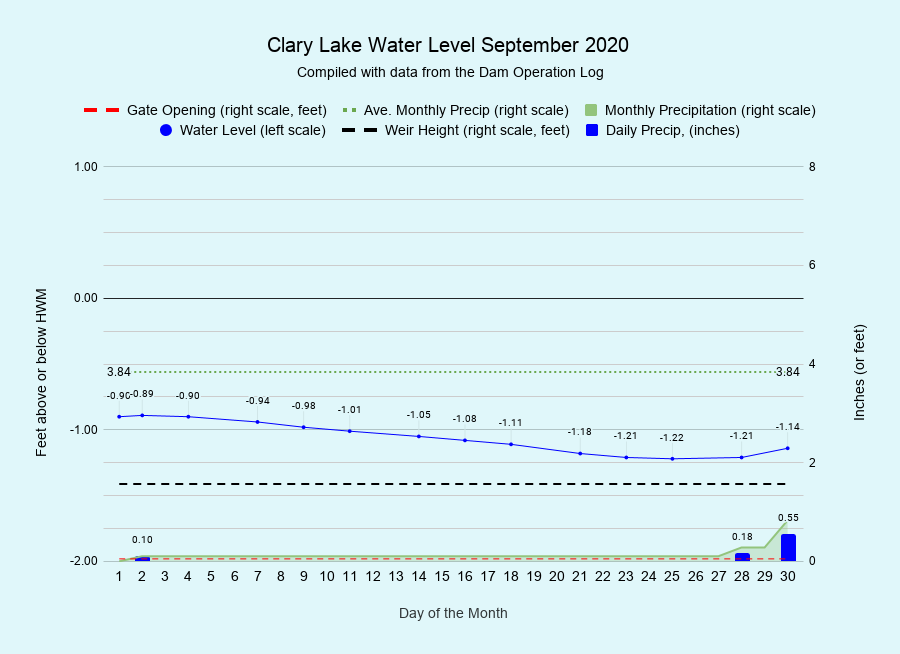
I have archived the September 2020 Water Level Chart (at left). September water levels were characterized by a leisurely drop over the course of the month from a high of -0.89 feet at the start of the month to a low of -1.14 feet at the end. On average the water level in August was 0.3 feet (3.6 inches) lower than it was last August. The real news in September were the severe drought conditions that have persisted (and worsened) for the entire month. We started the month slightly ahead of the yearly average and received only 0.10 inches of rain on September 1st and no more rain until storms on the 28th and 30th. That’s 25 days without a drop of rain. We ended the month with a total rainfall of only 0.74 inches, fully 3.10 inches shy of the monthly average of 3.84 inches. For the year we’re 3.04 inches below average for this date. We’re heading into October with a severe deficit of rain. Hopefully that will change soon.