September 2019
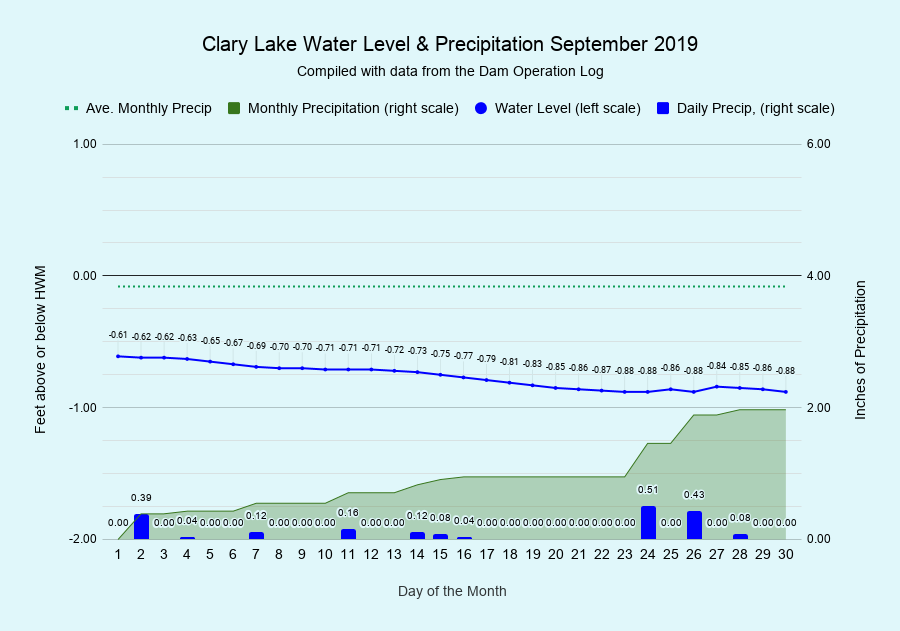
I have archived the September 2019 Water Level Chart (at left). The most notable thing the September chart shows is how dry it’s been! We received only 1.97 inches of rain, just a little over 1/2 the September normal rainfall of 3.84 inches. As of the end of August we were 1 inch above normal rainfall, but the lack of rainfall in September means we’re now 0.85 inches BELOW normal for this date. Hopefully precipitation will pick up later this fall.
Despite the lack of rainfall in September, the lake level remained well within our target range of -0.50 to -1.0 feet below the HWM (high water mark) while maintaining the required minimum flows. We attribute this relative lake level stability to our management practices (as described in our Water Level Management Plan) and the repairs we performed last Fall which have reduced leaks to a minimum. Per our plan, we will continue to gradually lower the lake level in October to between 1 and 1.5 feet below the high water mark, and we expect to reach the maximum draw down of approximately 2 feet below the HWM by the end of November where it will remain until early Spring.