October 2020
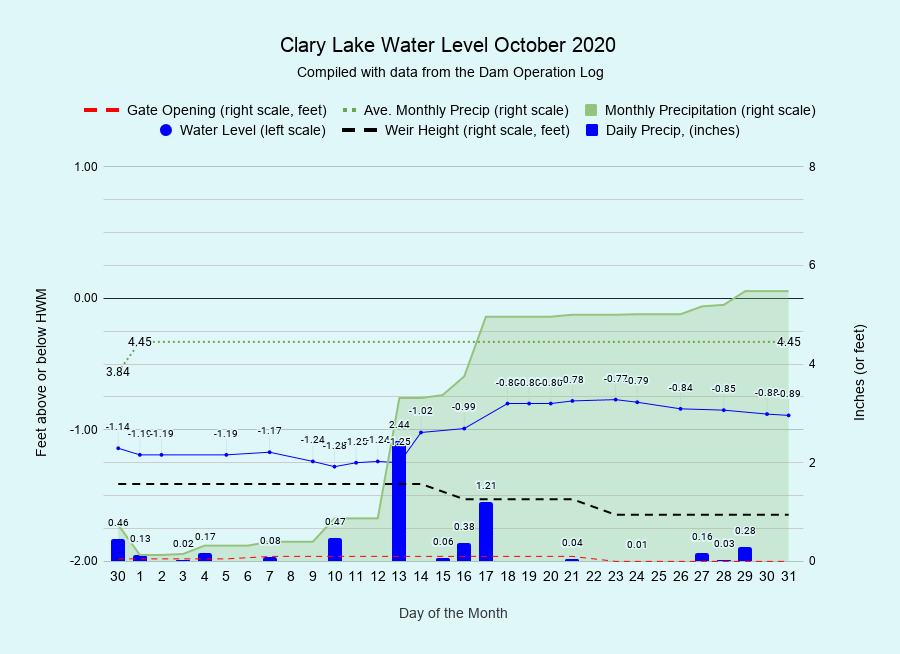
I have archived the October 2020 Water Level Chart (at left). October water levels were right about where we want them this time of year- down about a foot, more or less. Substantial rainfall around the middle of the month both signaled the end of severe drought conditions and pushed the lake level to a high of -0.77 feet below the HWM and it’s been falling gradually ever since. We started the month -1.14 feet below the HWM and ended the month higher at -0.89 feet. If you’ll recall, rainfall in September was almost nonexistent until the very end of the month. October started off with minor rain events until the 13th of the month when we received 2.44 inches in one storm. We ended up with 5.48 inches of rain for the month, 1.03 inches more than October average of 4.58 inches. Nonetheless, ground water supplies are still below normal as those of you with dug wells are well aware. As of the end of the month, our part of Maine remains in severe drought. We’re 2.01 inches below the yearly average for this date.
The “Day of the Month” X axis on water level chart now starts with the last day of the previous month, a feature on charts from a few years ago. This is so you can see at a glance what the previous month rainfall total was and the trend in the water level- up, down, or flat. This month’s chart shows that on September 30th, total monthly rainfall was almost nonexistent at just a hair over 1/2 inch and the water level was trending down. You’ll find this monthly water level chart and more on our Dam Operations Log. You’re welcome!
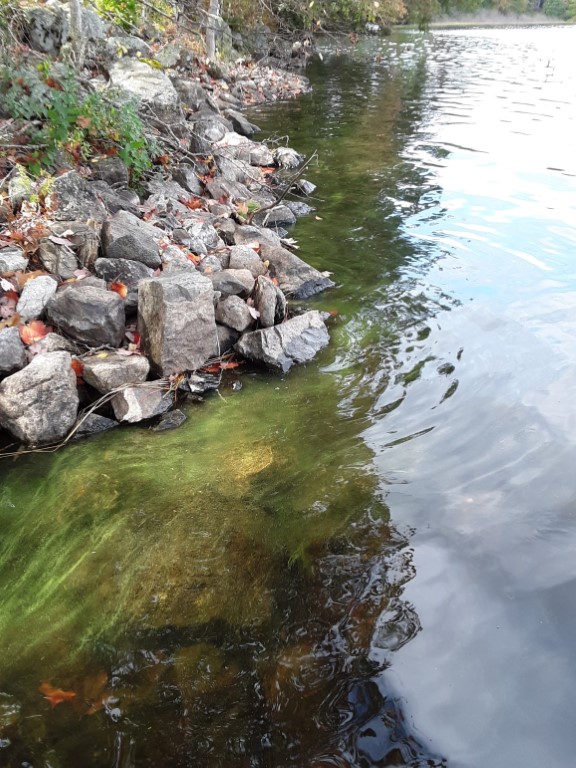 As is often the case, water quality as measured by lake transparency during the month of October declined somewhat as evidenced by a secchi disk reading taken on our final water quality monitoring session of the season, on October 10th. That reading of just 2.96 meters (9.7 feet) was down from 4.26 meters (14.0 feet) observed a few weeks earlier, on September 18th. This decline in transparency was due to algae growth resulting from the lake “turning over” and mixing Phosphorus rich bottom water with the upper layers and in so doing, giving the cyanobacteria near the surface a boost of plant food. This is a well understood phenomena. During the summer, highly reactive Phosphorus comes out of bottom sediments due to the anoxic (oxygen deficient) conditions in the water at the lake bottom. As long as the lake remains stratified with a thermocline down around 3-4 meters, that bottom water remains separated from the algae that mostly live in the upper layers, lit by sunlit. When the lake turns over and mixes as it does in the early fall, we’ll often see a short-lived but occasionally intense burst of algae growth, short-lived because the available food supply is limited. This “bloom” may show up only in isolated parts of the lake, or it may be more widespread. After a short growth spurt, the algae die and float to the surface where wind and waves drive their decaying carcasses to the shore where it can be observed as a green scum on the water surface. It can be confused with pollen on the water but both the color (bright green) and the timing (fall) is wrong for pollen. I took the picture at upper left on the morning of October 10th. The green scum was gone 15 minutes later.
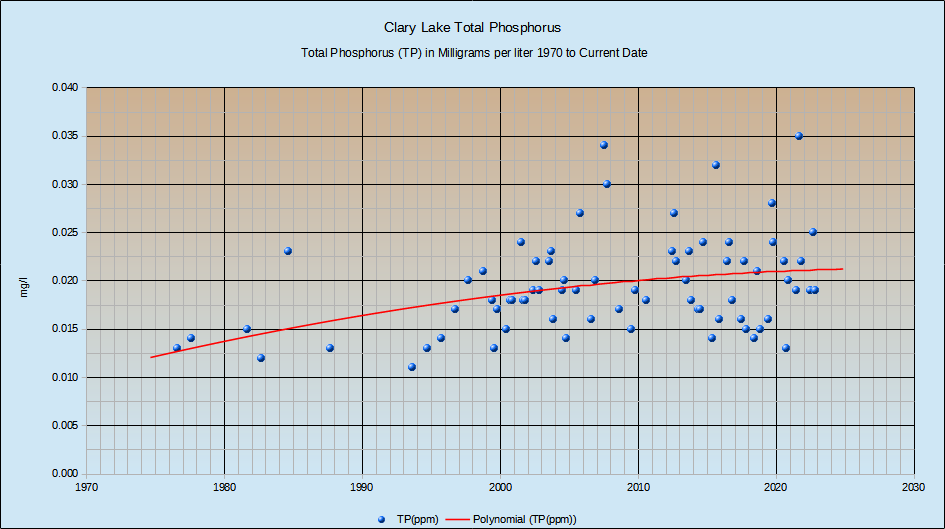
Clary Total Phosphorus
After a very low Total Phosphorus test of 0.013 mg/L (milligrams per Liter) on September 1st, our final Phosphorus test of the year (we typically take 3) yielded a result of 0.020 mg/L which is about average. As the chart at left shows, Total Phosphorus is trending DOWN, which is a good thing. Dry weather favors most lakes, Clary included, with better water quality. You’ll find more water quality data on our Clary Lake Water Monitoring Data page.