
October 2019
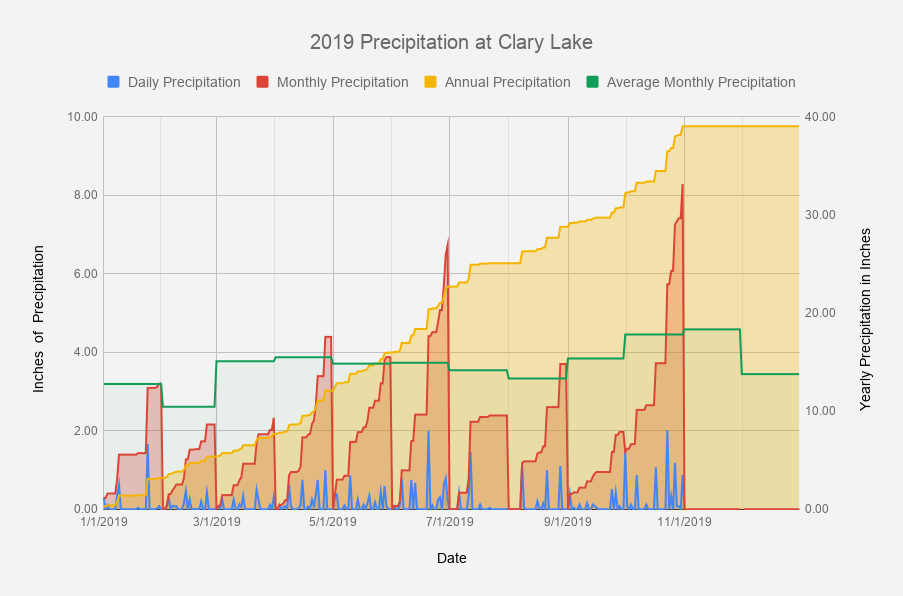
I have archived the October 2019 Water Level Chart (at left). The most notable thing the October chart shows is Holy Hannah did we get a lot of rain 🙂 We started the month 0.85 inches BELOW average and ended the month just shy of 3 inches ABOVE average for this date. All told we received 8.28 inches of rain in October whereas average rainfall for October is a “only” 4.45 inches. We received almost twice that. We’re now at 39.02 inches for the year, just 5 inches shy of what we’d expect to receive for the whole year, and we still have 2 months to go (see Precipitation chart below). All that rain complicated our efforts to draw the lake down this fall, and currently the water level sits at around 0.60 feet below the HWM, give or take- a level more appropriate for mid to late Summer.
Our efforts to raise the lake level in the Spring to Summer levels and to lower it in the Fall going into Winter present somewhat different challenges from maintaining it during the Summer season. In the Spring we want to capture water whereas in the Fall we want to release it; the challenge in both cases is not over-spending our water budget so we can maintain the required minimum flows when raising or lowering the lake level. Overshooting our target wintertime water level of -18 to -24 inches below the HWM would be too easy! To add to the challenge, we never know how much rain to expect both in the Spring and in the Fall. Consequently, we try to err on the side of caution, figuring we can always let more water out of the lake if we have to, but only Mother Nature can put more water into it. This Fall, we’re letting out a LOT of water.
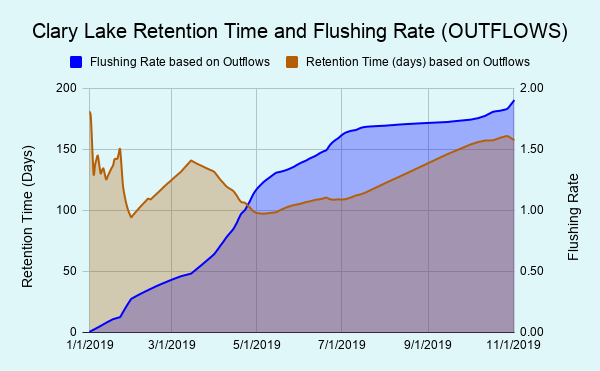 Before I move on I want to talk briefly about Flushing Rate and Retention Time. In simple terms, the flushing rate is how many times a lake completely replaces it’s volume in one year and the retention time is how long a given volume of water remains in a lake before finding it’s way out. Retention time is the reciprocal of the Flushing Rate.
The published flushing rate for Clary Lake is 1.81 meaning that in one year, Clary should fully replace it’s volume 1.81 times, or almost twice. This is quite high compared to many Maine lakes. China Lake for example has a flushing rate of only 0.35 (see chart below). Since we’re tracking both inflows and outflows for Clary Lake, I’ve been 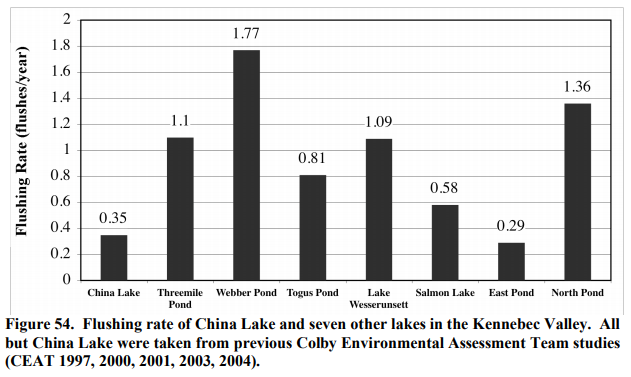 able to calculate Clary’s flushing rate and retention time using both inflows and outflows. Theoretically they should yield similar results, but we didn’t start the year with a full lake so they not going to agree. Therefore I’m going to use outflows for this example. It’s not the end of the year yet, but it’s coming right up, and so far the calculated flushing rate (based on outflows) is 1.90x which is higher than the published value and reflects the increased runoff we’ve seen this year. The average Retention Time for Clary lake (also based on outflows) is 125 days.
So why do we care about Flushing Rate and Retention Time? By measuring the inflows and outflows of the lake, it is possible to track the movement of nutrients into and out of the lake. The flushing rate can provide some indication of the recovery or self purification rate of lakes. So now you know!
You can find most of the above charts and graphs and a WHOLE LOT MORE on the Dam Operation Log. Also don’t forget to keep an eye on our Current Water Level Chart and Clary Dam Flow Statistics 🙂