July 2019
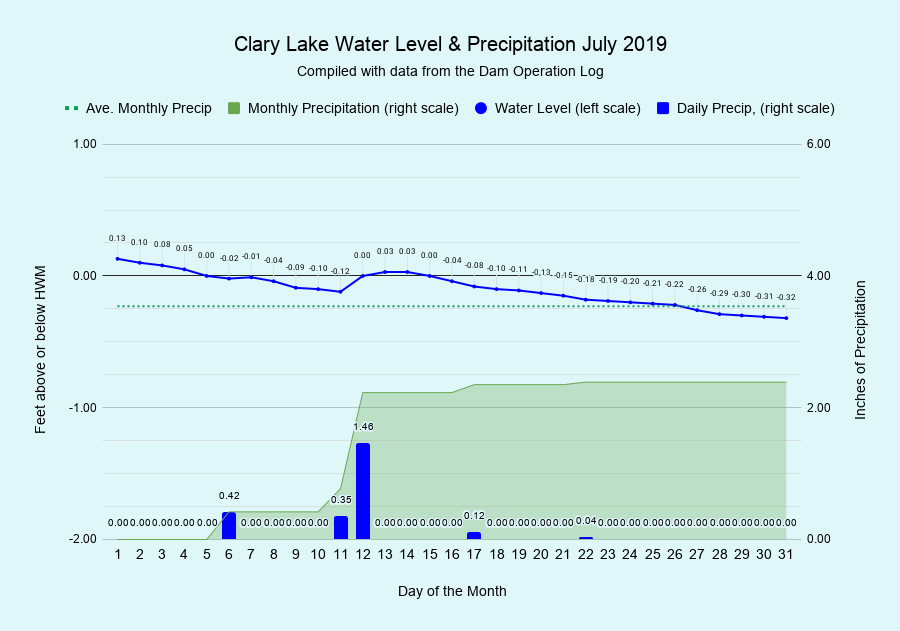
I have archived the July 2019 Water Level Chart (at left). The most notable thing about this chart is it shows rainfall fell off a cliff in July with only 2.39 inches being recorded for the month, over an inch less than the average of 3.54 inches for July. The latter part of the month has been driest: we’ve only received 0.16 inches of rain since July 13th. That said, due to the above-average rainfall received in April, May, and June, we’re still 0.65 inches above the yearly average for this date. While we’re not in official drought territory yet, we will be soon if this dearth of rainfall continues.
The lake level has fallen since the first of the month, starting out 0.13 feet above the HWM and ending the month 0.32 feet below the HWM, a total range of only 0.45 feet. Still, despite the lack of rain, the lake level is higher now than it historically would be on this date; water was still flowing over the top of the dam until just a few days ago. We’ve only been able to maintain this high water level because of the dam repairs we made late last fall which has reduced leaks to a just a few cubic feet per second, which conveniently supplies the minimum flows (1.9 cfs) for this time of year. We anticipate the lake level will continue to fall an additional 6-8 inches through the month of August, depending on rainfall.
The Water Level Order requires we maintain the lake at it’s “full capacity” from ice out in the Spring until August 1st. Elsewhere in the Order it also states the lake level should be maintained at the High Water Mark as determined by the DEP water level survey. While we have targeted the official HWM elevation, one can argue that the water level corresponding to Clary’s “full capacity” is that at which the water level is at, but not flowing over, the top of the dam. That “full capacity” elevation is actually 0.3 feet (3.5 inches) below the actual HWM elevation. This situation is clearly shown on the following profile of top of the Clary Lake dam:
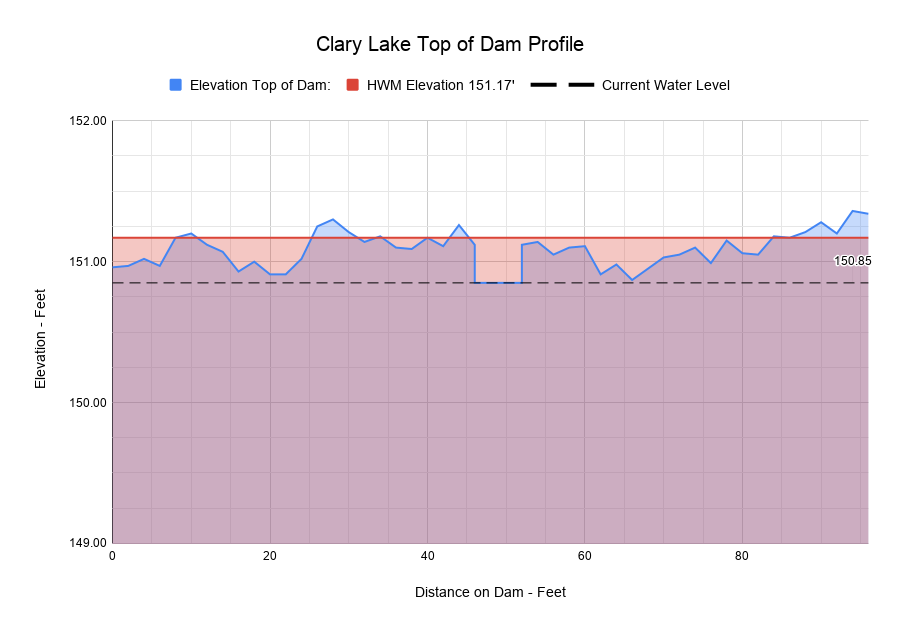 The view is from the road looking upstream at the dam and the red line shows the elevation of the HWM in relation to the top of the dam. The irregular blue line represents the profile of the top of the dam (vertically exaggerated) and the dashed black line is the current water level (150.85 feet) which also corresponds with the top of the weir. In other words, if you were to stop by the dam today you’d see that the lake level is right up at the top of the weir. We use this profile to calculate over topping flows, but it also serves to graphically illustrate the relationship between the water level, the weir elevation, the High Water Mark, and the top of the dam- which as you can see, is NOT flat! You can also see from this chart that when the lake level is at the official HWM, water is flowing over 90% of the top of the dam with only 2 small high spots still above water.
As mentioned, there is some vertical exaggeration: the dam looks a lot flatter than this image shows. The total range in elevation across the top of the dam from low to high is 0.51 feet with the lowest spot about 15 feet to the right of the weir which has an elevation of 150.87 feet (or 0.3 feet below the HWM) and the highest spot on the far right side is at an elevation of 151.36 feet (0.19 feet above the HWM). The total spillway length is 96 feet.
This chart (and others) can be found on the Clary Dam Flow Statistics page. You’ll find it (and lots of other interesting information!) on the Dam Profile sheet of the Clary Lake Dam Operation Log.