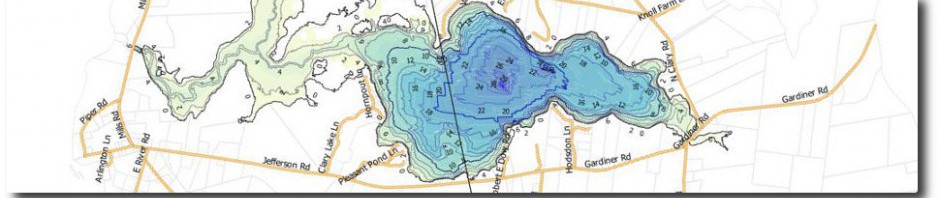
Category Archives: Weather

28 March 2020: We Have An Ice Out Contest Winner!

Linda Gallion

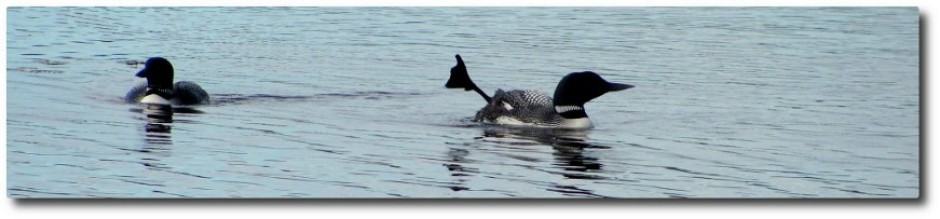
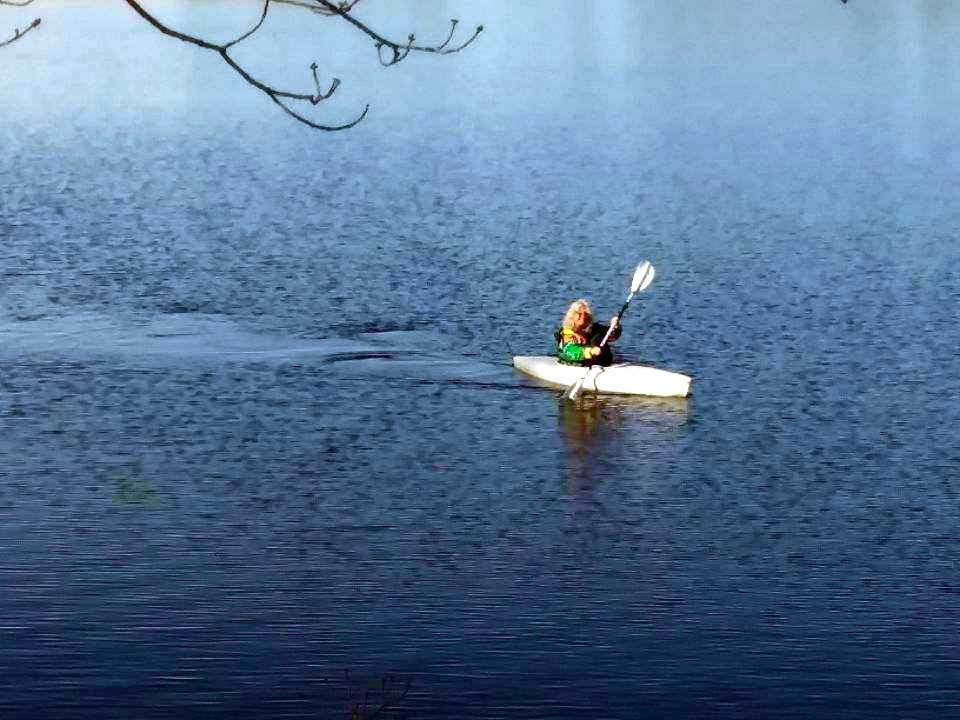
Finally! David Hodsdon has proclaimed this year’s ice out date to be March 27th. That was the day when all the ice was completely gone from the coves and inlets around the lake. That makes Linda Gallion (picture at left, from last year’s Annual Meeting) the winner of our 2020 Ice Out Contest! Her’s was the closest guess (March 24th) without going over. Linda has been a long time CLA member and served as Treasurer for ten years from 2005 to 2015. Congratulations Linda! Hope you enjoy your tee shirt! Many thanks to all who participated in our first Clary Lake Ice Out Contest. Here are their guesses:

2020 Ice Out Contest Guesses

Ice Out was determined to be March 27th. The closest guess wins!
NameGuess
Jane Chase03/14/20
Rick Gallion03/14/20
Jack Holland03/17/20
June M. Lordi03/23/20
Linda Gallion03/24/20
ICE OUT:03/27/2020
Lee Prager03/28/20
Paul Devlin03/28/20
Steve Cowles03/29/20
Malcolm B03/29/20
David Knight04/01/20
Carolyn Curtis04/02/20
Gareth Bowen04/03/20
Leslie Gillette04/04/20
Terry Crummett04/07/20
Kate Seba04/09/20
Arlene Wing04/12/20
Karen Stutzer04/14/20
Dan Burns04/16/20

Resized952020032695154444955643
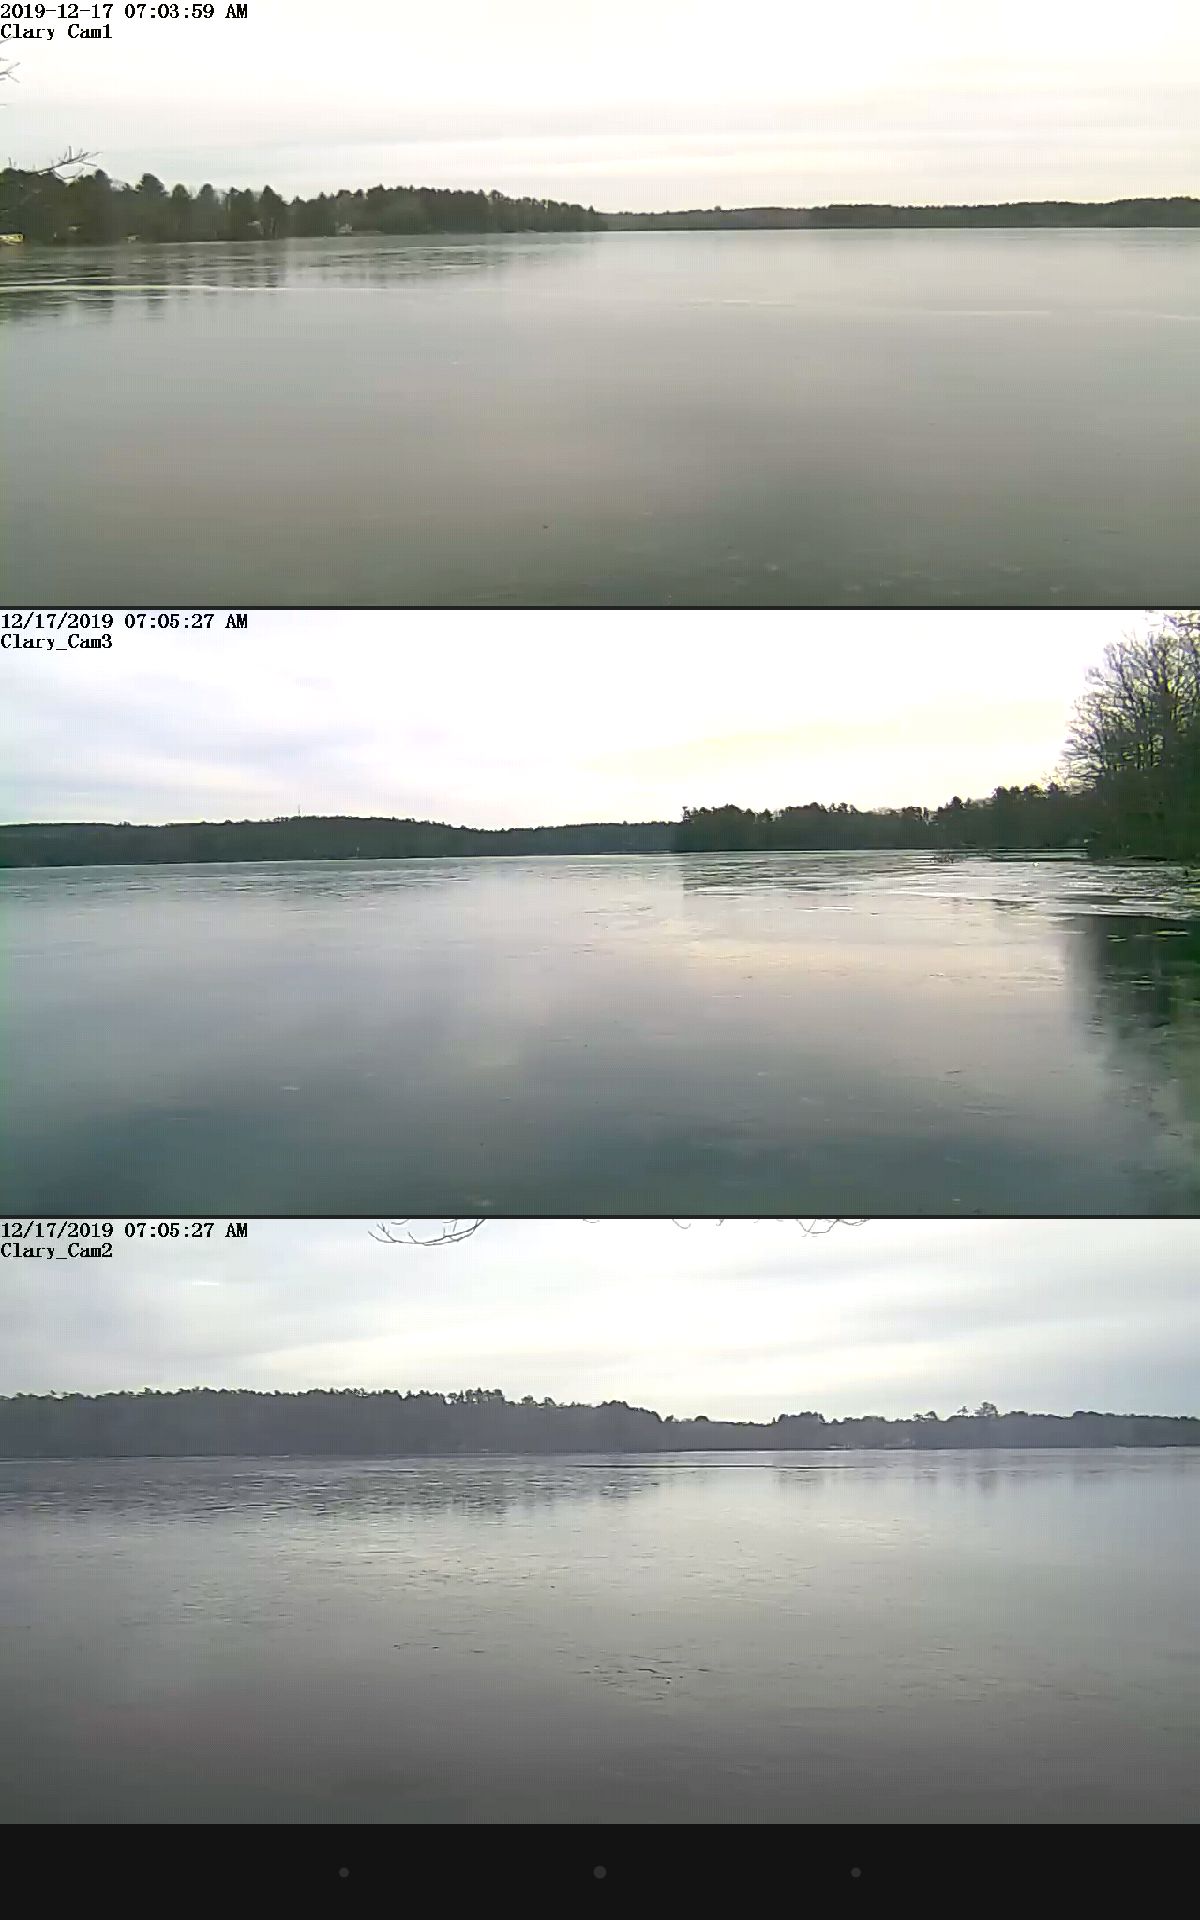
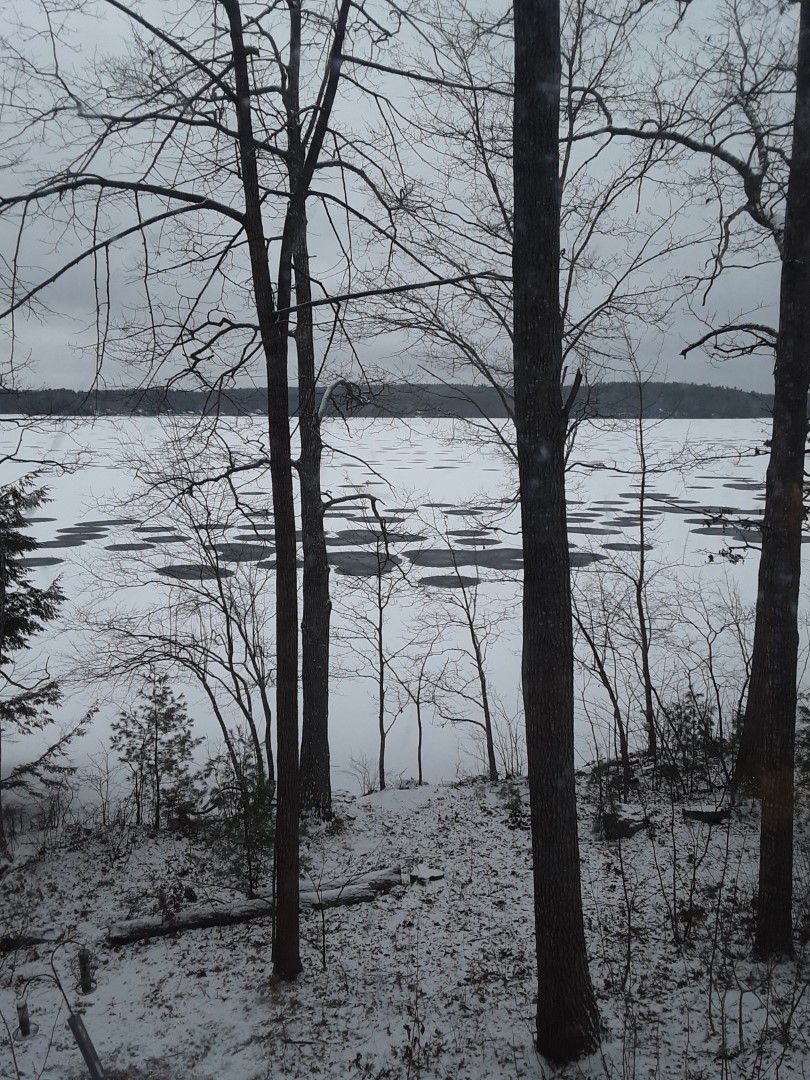
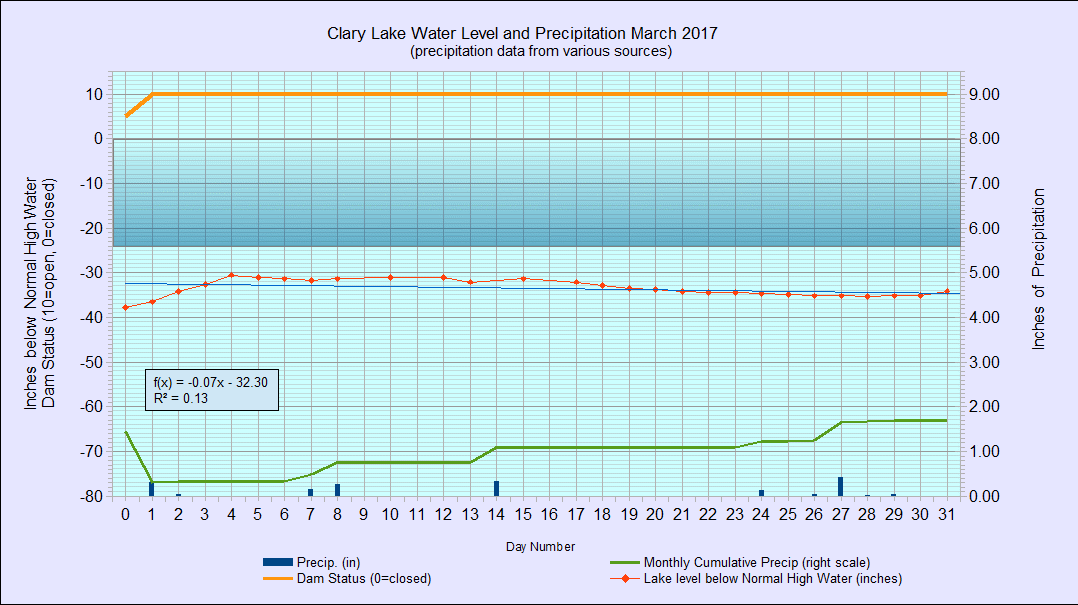
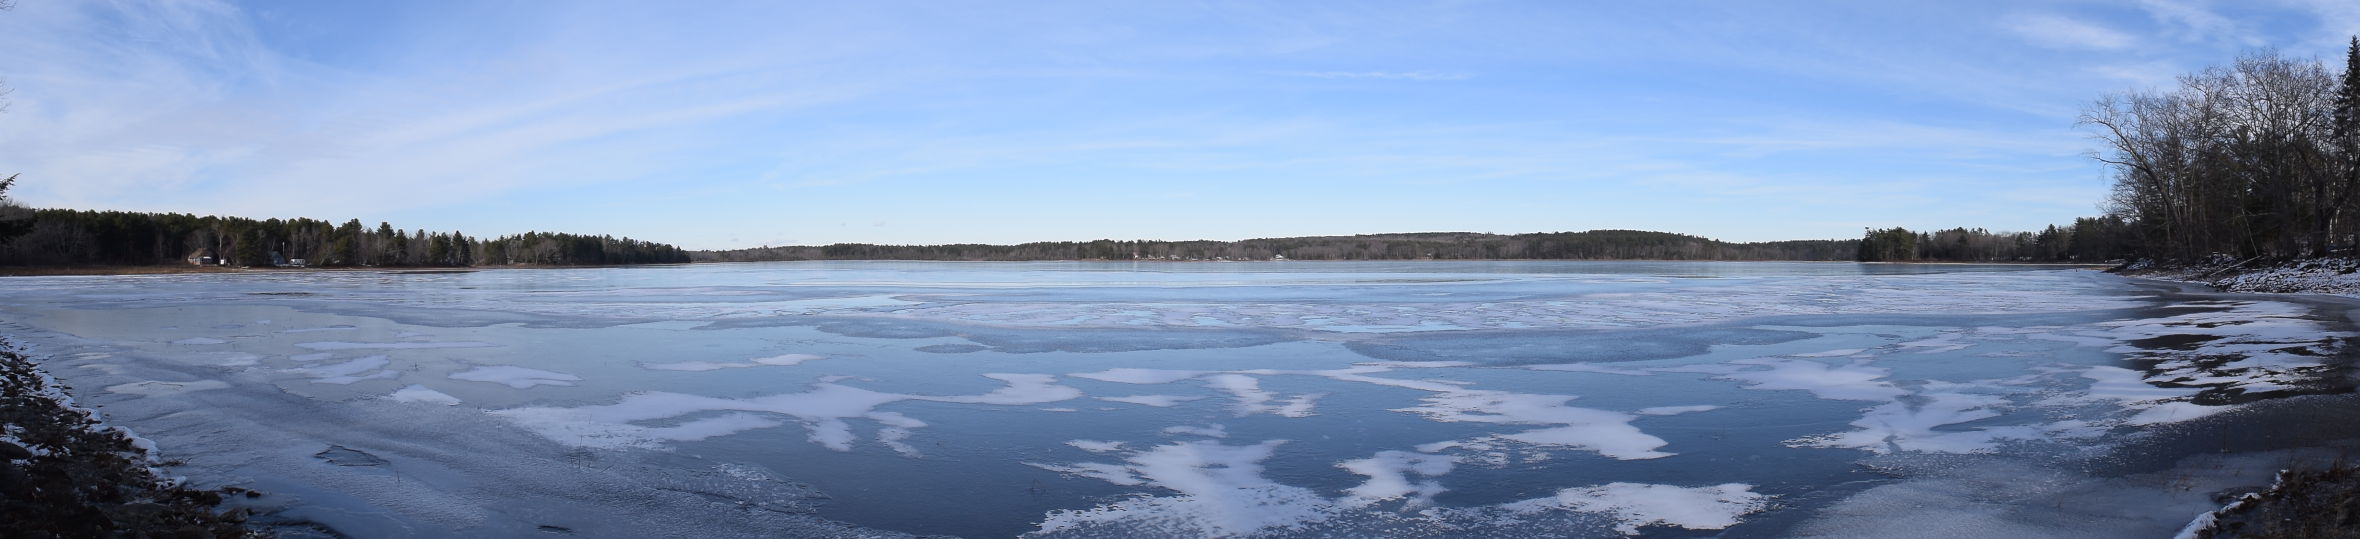
If you think it took a longer than usual for the lake to become ice-free this year it is because it did! I don’t think the ice was really ready to melt off, but a heavy rain event on March 13th which dropped 1.20 inches of rain followed by strong winds the next day got rid of a lot of ice on the north side of the lake. There were actually people ice fishing the previous weekend. After that initial melt-off, the ice seemed to take forever to melt out of the coves on the south side, and down by the boat launch.

2020 Clary Lake Ice Out Contest

I’ve wanted to have an Ice-Out contest for years but never found the wherewithal to actually do it. Until now. Guess the correct ice-out date and win a “We Give A Dam” tee shirt. FYI, the earliest the lake has been deemed completely free of ice was on March 13, 2016; the latest the ice has gone out was on April 24, 2001. Visit our Ice In and Ice Out page to see all our historical data back to 2001. Reviewing historical ice-in and ice-out data is NOT CHEATING.

We’ll close the contest some time before the ice actually goes out. And yes, you can submit more than one guess, but only your first guess will count. Or maybe your last guess 🙂

17 December 2019: Clary Iced-In For The 3rd Time! [UPDATED]

Clary-frozen-12-17-2019Clary Lake has had a hard time staying frozen this year! It initially completely froze over on December 4th and remained well frozen for a week. Then warm temperatures and heavy rains caused it to mostly open up again on December 11th. It had completely refrozen by the next day December 12th, only to completely melt off again on December 15th! This morning, as you can see on the composite photograph of the 3 Clary Webcams, it appears completely refrozen with the possible exception of a small sliver of open water over on the east end of the lake. This afternoon’s expected snow fall will show if that’s really the case. Perhaps this is it. I don’t see anything in the forecast to suggest the lake will melt off again, but you never know.

While December 4th is early for ice in, historically it’s not particularly early at all. I recall as a kid ice skating on Clary Lake at Thanksgiving. Visit our Ice-In and Ice-out dates for Clary Lake page. We have records available back to 2001.

20191217_141327-Large[UPDATE] I guess I wouldn’t be calling the lake fully frozen just yet, judging from the amount of water that’s leaking up onto the surface. When it first started snowing today, dozens of small wet spots appeared. As the snow continued, the wet spots grew in size and number. There must be small holes in the ice for this to occur. Perhaps a good hard freeze will finish the ice-in process!

05 July 2019: Moderate Algae Bloom in Progress

20190703_122534

Cyanobacteria coloring the water.

You may have noticed a green scum drifting on the lake surface recently or seen loads of green particles suspended in the water and thought it was pollen. Well, it does look a lot like the pine pollen that was blowing around last week, but that was yellow, and this stuff is green. Clary Lake is actually experiencing moderate blue-green algae growth resulting in an algal bloom. This early season algae bloom has no doubt been fueled by excessive runoff from all the rain this spring (15″ since the 1st of April!) which has introduced Phosphorus and other nutrients into the lake. Phosphorous is the primary food for plants and algae. Blue-green algae technically is a phylum of bacteria (cyanobacteria) that obtain their energy through photosynthesis. Another likely source of Phosphorus is rotting terrestrial vegetation. For years, better than 300 acres of drained wetlands have been growing grass, goldenrod, alders, and other terrestrial plants and that land is now under water, and the vegetation is rotting. This releases nutrients including Phosphorus in the water, helping to fuel aquatic plant and algae growth. Here are a few more photographs:

All this rainfall has also resulted in significant flushing of Clary Lake, well in excess of normal. Since January 1st, the lake’s entire volume of water (7,224 acre-feet) has been replaced almost twice. The inverse of the flushing rate is retention time (how long water stays in the lake) and that figure has decreased to about 92 days. The published “flushing rate” for Clary Lake is 1.81 times per year. We’re going to exceed that value by a significant amount. This will help “wash out” the nutrients currently in the lake, but will also result in more nutrients being brought into the lake. This is why controlling non-point sources of soil erosion and sedimentation is So Important: it doesn’t help replacing nutrient-laden water with more nutrient-laden water.

I expect this current algal bloom to dissipate soon, and it remains to be seen if we’ll have additional algae growth this year. Under the circumstances, I wouldn’t be surprised. It is important to remember that even though the dam has been repaired and the lake level restored, the ecology of Clary Lake has been severely damaged as a result of the 8 years of low water and it going to take some time to recover. Clary is still at-risk from both natural and man-caused issues and deserves our ongoing attention.

27 October 2017: Much Needed Rain Has Little Effect On Clary Lake Water Level

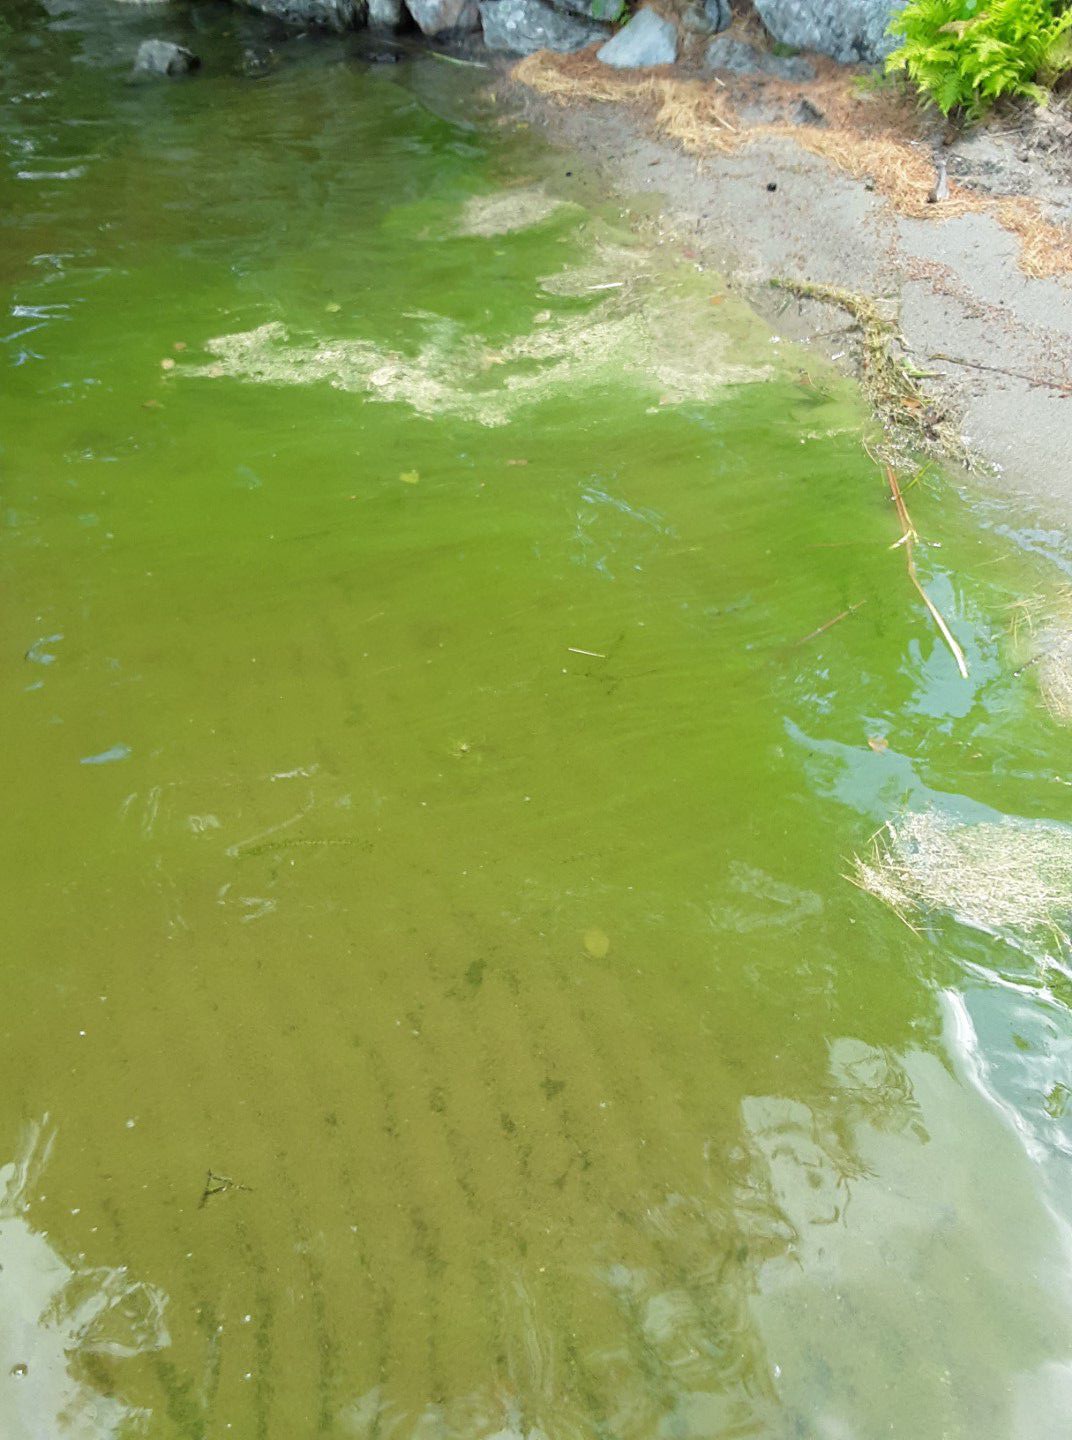
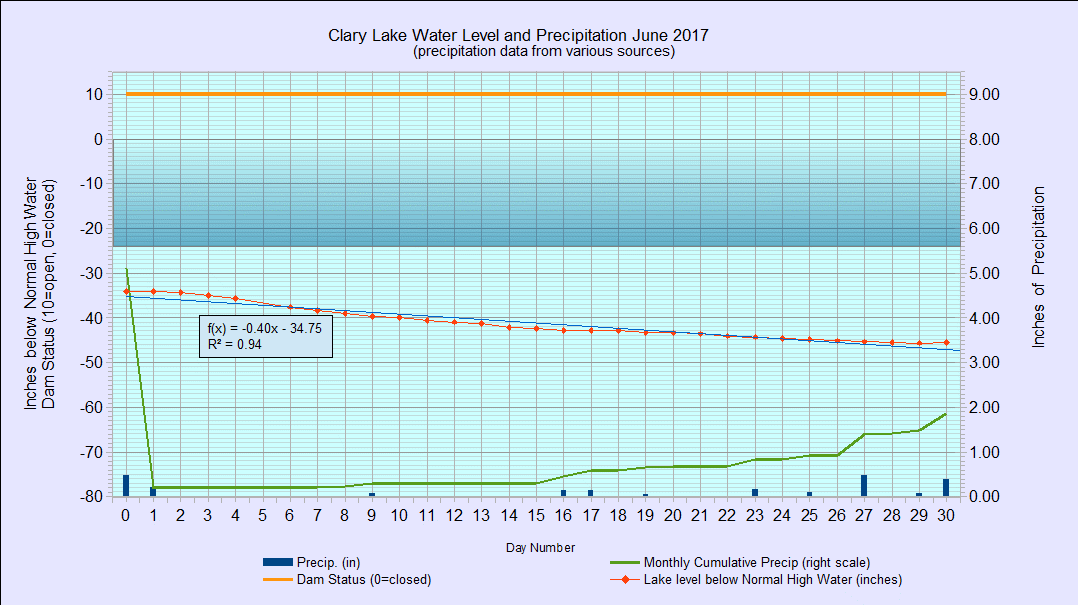
We just received 5.15″ of rain in a little over 2 days which, had we not been suffering under drought conditions, would have brought the lake up close to two feet or more. However because so much of the rainfall ended up soaking into the ground and not running off into the lake, the water level has only come up 7.44″ yielding a pathetic runoff multiplier of about 1.4X. Now that the ground is pretty much saturated, we should get more bang for the buck from the next rain storm due in this coming Sunday and Monday.

12 August 2017: ANNUAL MEETING NOT CANCELED!!

Despite the somewhat wet and rainy conditions outside your window this morning, we’ve been assured that Partly Sunny conditions will arrive for this afternoon. The rain is forecast to stop later this morning with only a chance of showers late this afternoon and evening.

We will NOT be invoking the rain date provision of our meeting announcement! Going forward we will be moving away from having a rain date at all, which means finding a venue that works rain or shine. This time of year, it’s hard enough to schedule an afternoon let alone keeping 2 consecutive afternoons available. People are busy.

Hope to see you at the meeting!

June 2017 Water Level Chart Archived

6 waterlevelchart_June2017

June 2017

I have archived the June 2017 Water Level Chart (at left). The most notable feature of the June chart is the slow steady decline in the water level on the one hand, and how little the lake level actually fell over the course of the month. The water level fell or remained unchanged every day except the last day of the month when it rose a small fraction as the result of 0.46″ of rain received. That said, the lake only lost a total of 11.4″ in 30 days for an average drop of 0.38″ per day. With the lake at this general level, with the gate wide open, and with so little rain having fallen, I would have expected the lake to have dropped more like 22″ to 24″ over the course of the month- twice as much as it actually fell. I am at a loss to explain this except to speculate that either a) there was considerably less water leaving the lake than expected or b) there was a lot more water entering the lake than expected or c) a combination of both a and b. This bears investigation. Continue reading

[UPDATED] Clary Lake Ice Out Video April 13, 2017

Here’s a video of Clary Lake ice out on April 13, 2017 made from images from Clarycam 2 and Clarycam 3. Technically the ice isn’t fully out yet, but for me from where I’m sitting it’s ALL GONE. As of this morning however, there was still quite a bit of very gray looking ice in the east end of the lake almost to the State boat launch. I fully expect it will be out before the end of the day now that the sun is getting up and the wind is picking up.

I would have included a segment from Clarycam 2 sitting down on David Hodsdon’s shore line, but it has stopped working. Too soon to say whether or when we’ll replace it, or with what. I’m actually a little disillusioned with these Foscam cameras: remote access to them is tedious, the proprietary software used to access and manage them is one step above garbage, and the browser plugin to view realtime video is no longer supported by any reputable web browser. I have only got it working by installing an Extended Support Release of Firefox. Unacceptable.

[UPDATE]: David Hodsdon has informed me that his camera is truly dead. He thinks is it still under warranty and is going to see about getting it repaired/replaced.

Incidentally, David sent me the image that I’m using as a header image on this post. He spent some time the other day waiting for just the right conditions to take the picture.

March 2017 Water Level Chart Archived

3 waterlevelchart_March2017

March 2017

I have archived the March 2017 Water Level Chart (at left). The most notable feature of the March chart is the relatively stable water level throughout the entire month. The water level started out at -36.48″ below the high water mark [HWM], hit a high four days later of -30.48″ below the HWM on the 4th, and after falling very gradually it ended the month only 2.28″   lower than it started, at -34.20″ below the HWM, and this with the gate wide open for the entire month! Where did the runoff come from to offset all the water leaving the lake? Continue reading

11 December 2016: Clary Lake Fully Iced Over [UPDATED AGAIN]

UPDATED AGAIN: David Hodson emailed me this afternoon to say that the final patch of open water has finally frozen over making the official Ice-In date this year December 12. Honest!

UPDATED: Clary Lake NOT fully iced over. David Hodsdon and I conferred this morning and he told me his end was fully frozen over, but he failed to notice about 1/2 an acre of open water in the cove by Jack Holland’s house. I guess there were some geese swimming in it this afternoon. Oh well. Retraction time. Stay tuned!

Thanks to overnight temperatures around 0° Clary Lake was completely frozen over this morning. It remains to be seen if the ice cover can survive the rain, snow and warmer temperatures forecast over the next couple of days.

DSC_3576-ice-in-11-december-2016

View Full Sized Image

November 2016 Water Level Chart Archived

11 waterlevelchart_November2016

November 2016

I have archived the November 2016 Water Level Chart (at left). The most notable feature of the November chart, like most of the other charts this past summer and fall, is how slow the lake level has been responding to rainfall. I am dismayed at the abysmal rate Clary Lake is filling up this fall and I’m sure a lot of you share that sentiment. Despite having received what seems like a “reasonable” amount of rain over the past two months, the lake level stubbornly refuses to rise as expected. The lake dropped to 60″ below the high water mark back on July 27th and continued from there to drop to a record low of -67.25″ on October 8th. Since then we’ve received 7.31″ of rain which has brought the lake up only a hair over 7″ to -60.17″ below the high water mark on the last day of the month. In a “normal” year that much rain would have brought the lake up the better part of 30 inches or more. Continue reading

18 September 2016: NIDIS Drought Meter Now Online

sev
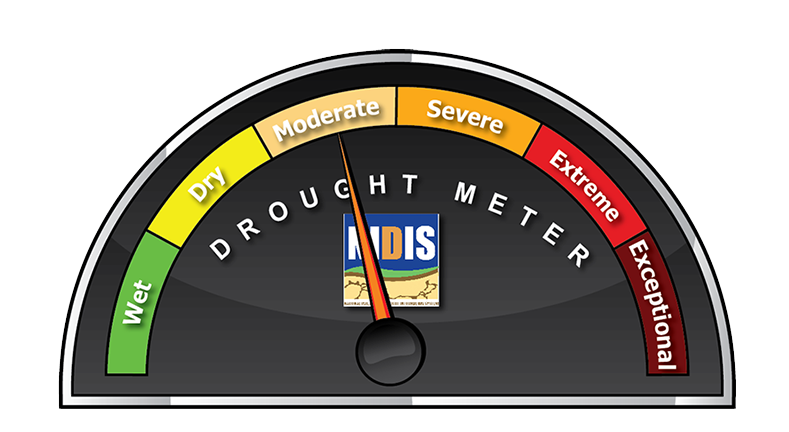
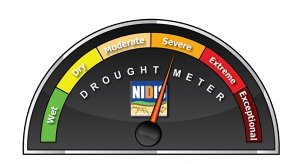
I don’t need to tell anybody that we need rain. For some time now we’ve been experiencing SEVERE drought conditions around Clary Lake and SEVERE to EXTREME drought conditions in and around New England, depending on locale. I found this neat CGI script at the
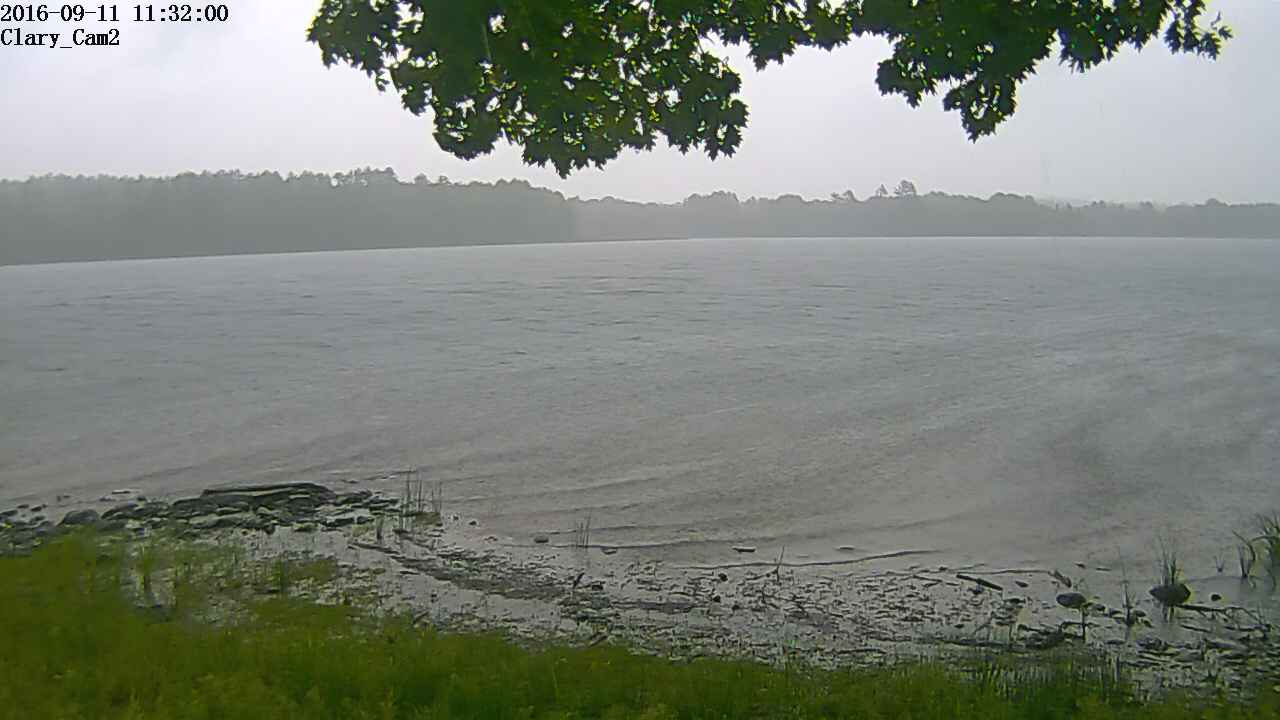
  National Integrated Drought Information System site that provides up-to-date drought information and decided to put it on our website. Enter one of Clary Lake’s 2 Zip Codes (Whitefield o4353 or Jefferson 04348) for current drought conditions here. For current drought conditions in your area, enter your own zip code (or search for one). You can reset it with the reset button to check different areas. It works for the entire country.

Once you’ve entered a zip code, you’ll find some useful information by following the links provided under the Drought Meter graphic. The National Integrated Drought Information System is a great site to poke around. I’ve added it to our Links & Resources page.

I have put up a Drought Meter page. Check it out. You’ll find the page linked under the Weather Main Menu heading.

14 September 2016: ClaryCam2 Out of Service

campic

ClaryCam2 Out of Service

During that thunderstorm we had last Sunday, David Hodsdon’s webcam got juiced by lightning shortly after the webcam picture at left was uploaded to the website. The power adapter fried and needs to be replaced. Hopefully that’s all that happened and the camera is still OK. In any case, ClaryCam2 is off line until further notice.

20 March 2016: IFW Commissioner Opens Fishing Season Two Weeks Early

DSC_1146From the Department of Inland Fisheries & Wildlife webpage:

Effective Thursday, March 17, the 2016 Open Water fishing season began, two weeks earlier than usual, per an amended rule by the Commissioner of the Department of Inland Fisheries and Wildlife.”

“The amended regulation allows bodies of water that were closed to open water fishing until April 1, 2016 to become open to open water fishing effective March 17, 2016.”

“Anglers throughout the state may now get a chance to enjoy the early spring by fishing on their favorite waterway earlier than usual.”

The two men who hit Clary Lake last Friday (picture above) no doubt wish they’d waited for warmer weather! The wind coming down the lake was very strong and bitterly cold, causing them to quit fishing early. The waves were breaking over the back of the boat as they were trying to maneuver it onto the trailer. At least there was enough water for them to launch and retrieve their boat.

February 2016 Water Level Chart Archived

2 waterlevelchart_February2016I’ve archived the February 2016 Water Level Chart (at left). The most notable feature is that the lake level stayed in a fairly narrow range around an average of -34.5″ belog the top of the dam, for all but the last 5 days of the month when the level rose to within touching distance of where it should be this time of the year, around -24″ below the top of the dam. This was by chance and not design because the gate has remained wide open since January 4th.

Another factor contributing to a (relatively) stable lake level is that between precipitation events, the lake level dropped an average of only 0.6″ per day, considerably less than the 1″ per day we would expect. This is likely due to frozen ground and warmer than usual winter weather resulting in increased snow melt and runoff. Recall this table which I first compiled back in 2012:

Lake level in inches below top of damRate of fall in inches in 24 hours
0" to 36"1"
36" to 48"3/4"
48" to 62"1/2"
Below 62"1/4" or less

We received a total of 3.26″ of precipitation in February or 0.82″ more than the average of 2.44″ for the month. Most of the precipitation was in the form of rain and/or ice. If it had all been snow we’d be in record territory but as it is, snowfall for the 2016 winter is well below average. This is likely attributable to the El Niño phenomena that is affecting everyone’s weather this year. The lack of significant snow pack does not bode well for spring runoff and lake levels this coming spring.