Category Archives: Technical Lake Stuff

February 2023 Water Level Chart Archived

2 Clary-Lake-Water-Level-February-2023

February 2023

I have archived the February 2023 water level chart (at left). February did not continue the wet trend that start the new year. On the contrary. February has the smallest average monthly precipitation of only 2.61 inches but we failed to reach even that low bar, receiving only 1.35 of precipitation for the month, mostly in the form of snow. We started February fully 4 inches ahead of average precipitation, but we lost ground, ending the month only 2.74 inches above average. Despite this, because we received so much precipitation in January, outflows from Clary Lake remained extremely high for the entire month. How high you ask? In the first two months of 2022, total outflows from Clary Lake amounted to 2231 acre-feet of water. In the first two months of 2023, outflows amounted to 4667 acre-feet or more than TWICE as much water. In other words, in the first two months of 2023 more than half the full volume of the lake passed through Clary Lake. In fact, outflows in the first 2 months of 2023 far exceed outflows during the same two-month period for the last 5 years, back to 2019 with the greatest disparity occurring in 2021: Continue reading

January 2023 Water Level Chart Archived

1 Clary-Lake-Water-Level-January-2023

January 2023

I have archived the January 2023 water level chart (at left). By far the most impressive thing about January was how much snow and rain we got! Total precipitation including rain and (melted) snow was 7.19 inches of water which is more than twice the average  precipitation for January of 3.19 inches. We’re starting off the year fully 4 inches above normal for this date. This will benefit ground water supplies this coming year. Even with all the snow and rainfall however, the water level was relatively stable though it was a little higher than we like to maintain it this time of year, due to all the inflows. January and February are usually pretty sedate months from a water level management perspective but this year we’ve had to open the gate a couple of times to let out more water just to keep the lake from overtopping the dam. There’s nothing wrong with overtopping, but this time of year it leads to ice formation which makes walking on the dam treacherous. We also like to keep the lake level lower in the winter to prevent ice damage to the shoreline. Mother nature however usually has her way. Continue reading

December 2022 Water Level Chart Archived

12 Clary-Lake-Water-Level-December-2022

December 2022

And that’s a wrap! I have archived the December water level chart (at left) bringing 2022 to a close. I guess the most impressive thing about December had to be the huge 24 hour lake level rise of 15.8″ from just 3″ of rain (and a little snow melt) on the day before Christmas for a runoff multiplier of over 5X. You can see excessive runoff this time of year because frozen ground means more rain runs off and less soaks into the ground. We’ve seen some big lake level responses to rainfall, but this is one of the biggest I can remember in a long time. Continue reading

14 December 2022: Clary Lake ALMOST but NOT QUITE Iced Over

Almost-ice-in-campicYesterday afternoon Clary appeared to be fully ice covered and I was about to call it, but the bit of snow we received in the night has revealed some open water in the usual spot off the point at the end of Duncan Road, and a seam in the middle of the lake is evident as well, perhaps opened up due to the high wind this morning. In early winter there is often open water off Duncan Point (aka Young’s Point) due to the speed of the current there. We’ll see if the current ice cover will survive the warm and wet coastal storm due to blow through here this coming Friday into Saturday.

We have historical ice-in and ice-out data for Clary Lake going back to 2001. If anyone has data for years prior to 2001 I’d love to hear about it.

November 2022 Water Level Chart Archived

11 Clary-Lake-Water-Level-November-2022

November 2022

I have archived the November water level chart (at left). Our plan at the beginning of the month had been to start dropping the lake to it’s early winter level around 14”-16” below the HWM. November is actually the month with the highest rainfall with an average of 4.58 inches but the first 10 days of the month were rain-free and we really didn’t know what to expect for the rest of the month so we didn’t take any drastic management actions, preferring to let the lake find it’s own happy level. Then the rains started first with a 1.85” rain event on the 11th followed by several more rain storms over the next 5 or 6 days which brought the lake level back up to the top of the dam by the 18th. On the 23rd we pulled the last two stop logs out of the weir and the lake level started dropping again, but two more large rain events towards the end of the month (1 inch on 27th and 1.34 inches on the 30th) brought us to 5.53 inches for the month and despite having opened the gate ¾ of a foot, the lake level rose back up to the top of the dam. We ended the month with a full lake and a full inch above November’s average rainfall. This brings us to 44.29 inches for the year to date, 3.67 inches more than average. Needless to say, the drought is over for this year. Continue reading

May 2022 Water Level Chart Archived

5 Clary-Lake-Water-Level-May-2022

May 2022

I have archived the May 2022 Water Level Chart (at left). From the beginning of the month on we saw an abrupt change from the above-average precipitation which has been the norm for the first 4 months of the year, almost as though someone had turned off the spigot! Total rainfall for the month was only 1.34 inches, well short of the normal 3.71 inches. Because we were 3.78 inches above normal at the end of April, we’re still 1.41 inches ahead of where we’d be in a “normal” year. However, simply looking at total precipitation gives you an unrealistic picture of actual ground water conditions: the fact of the matter is, the entire coast of Maine including Clary Lake is considered to be “Abnormally Dry” by the USDA Drought Monitor program. Continue reading

Lake Water Quality Monitoring Resumes for 2022

Clary Transparency

Kelsie French and I resumed our water quality monitoring efforts for 2022 on Saturday May 14th, a little later than originally planned due to circumstances which all seemingly conspired to keep us off the lake. We’re back in the saddle now however and plan to visit Clary’s deepest spot to collect data every couple of weeks this season. Continue reading

April 2022 Water Level Chart Archived

4 Clary-Lake-Water-Level-April-2022

April 2022

I have archived the April 2022 Water Level Chart (at left). April has been a very cold, very wet, and very windy month! The above-average precipitation with which we started the year has continued through April in a big way: we received fully 5.64 inches of rain in April or 1.77 inches more than the normal rainfall of 3.87 inches, fully 3.78 inches beyond where we would normally be on this date. We have received literally 5 months of precipitation in only 4. Impressive.

Not surprisingly, the lake level remained high for the month, staying somewhere between the top of the dam and the HWM for most of the month. It was quite stable really, fluctuating only a little over 4.5 inches from high to low. Only twice during the month did the water level rise above the high water mark, and at that only briefly. I love stopping by the dam and seeing water dribbling over the top of it. Continue reading

02 March 2022: Ice Berms & Pressure Ridges

With all the attention on Clary Lake ice this spring, it seems fitting to post this article I’ve been working on for awhile, yet another in our Continuing Education Series, based on the premise that informed people make better Lake Stewards! This post is on Ice Berms and Pressure Ridges and the science behind them and will be added under the Programs & Education menu heading.


IMG_1150_compressedI received a few inquiries about ice berms and pressure ridges in response to my post about February water levels so I thought I’d provide a little more information about these interesting phenomena and the science behind them. Imagine the forces at work that were responsible for the buckled ice in the photo at left! First we need to learn more about how water changes and what happens to it as its temperature changes.

Water becomes more dense (heavier) as its temperature drops, causing it to sink below warmer water: cold water sinks and warm water rises. We all know this much from going swimming and encountering that cold layer of water 4-5 feet below the surface. As its temperature drops, water continues to become more dense and continues sinking below warmer water until it gets down to about 39° F. Then something unexpected happens:  as the water cools, the molecular motion continues to slow down and as the water starts to assume the crystalline lattice structure that is ice, the distance between the molecules actually increases. The freezing water, rather than continuing to become denser, actually begins to expand, becoming less dense, causing it to float (it is this expansion as it freezes that ends up breaking water pipes). By the time water reaches its freezing temperature of 32° F (0° C) and changes to ice, it has expanded approximately 9% from its maximum density and a complete inversion from the usual summertime temperature stratification takes place. In the winter when the lake is ice covered, the coldest water is right under the ice and the temperature rises as depth increases so the warmest (and densest) water is at the bottom of the lake. This is completely opposite of what we see in the summer time with the warmest water at the surface and the coldest water at the bottom. Continue reading

01 April 2022: Unidentified Animal Sighted on Clary Lake

I spotted this Clary Lake critter this morning when I was out checking my rain gauge. At first I thought it was a goose but the sound it made wasn’t goose-like at all. Sounded more like… I dunno. It was weird. It didn’t stick around. Fortunately I was able to find a picture of it in the webcam archive. Anyone have any idea what this is?

March 2022 Water Level Chart Archived

3 Clary-Lake-Water-Level-March-2022

March 2022

I have archived the March 2022 Water Level Chart (at left). The above-average precipitation with which we started the year did not continue into March, the month’s precipitation of 3.31 inches fell about 1/2″ short of the normal 3.77 inches for March. However, despite the shortfall (if you can call it that), we’re still a solid 2″ above normal for this date and the lake level in March reflects that rainy trend. Our management goal in late winter/early spring is to raise the lake level up to high spring time levels. This year we just got there a little faster than in recent years, actually overtopping the dam in late February. The lake level exceeded the HWM briefly on March 23rd. You can see this year’s water level compared with water levels from 2018, 2019, 2020, and 2021 on our Current Clary Lake Water Level Charts page (see the 4th chart down). Continue reading

13 March 2022: Early Spring Dam Management

20220309_110621-MediumWe’ve begun our Spring management activities with the aim of getting Clary Lake filled up for another boating, fishing, and swimming season, about week earlier than usual because of all the snow and rain we’ve been blessed with this year. Our spring management includes adding stop logs to the weir to start raising the lake level to it’s spring high while opening the gate to increase outflows to maintain minimum flows, and also to keep the lake from rising too quickly. It’s a balancing act made more difficult with having to second guess the weather. Because of drought conditions the previous 3 years, it has been a challenge raising the lake level in the spring while at the same time maintaining outflows. We pretty much have the opposite problem this year! After the first two months of 2022 we’re 2.5 inches of precipitation above normal for this date. The picture shows Steve Cowles on March 9th cranking open the gate the other day, with Dave Knight standing by with the folding ruler. There are 4 threads to the inch on the screw, so opening the gate 12″ means turning the gate wheel 48 turns. That’s a workout. Today, we installed the last two stop logs in the weir. You can track all the action on the 2022 Dam Operation Log.

February 2022 Water Level Chart Archived

2 Clary-Lake-Water-Level-February-2022

February 2022

I have archived the February 2022 Water Level Chart (at left). The above-average precipitation with which we started the year (January ended 0.93″ above normal) has continued throughout the month of February which saw a total of 4.16″ of precipitation (water), the effect of which has been to put us fully 2.48″ above normal for the year to date. This bodes well for ground water supplies this spring, in marked contrast to the last 3 or 4 years. We’ll have to wait and see if the cycle of summer drought has been broken. All the rain and snow we received in February resulted in the lake level rising to unseasonably HIGH levels, overtopping the dam on February 23rd and coming to within half an inch of the HWM on the 25th. Continue reading

9 February 2022: How’s This For Confusing?

Everyone knows I love charts (and maps!). They’re a great way of visualizing data. Sometimes my love of maps and charts takes me to some  pretty strange places. Here’s an example of one of those places (at left). Every time I look at this chart I have to stop and peer at it for a moment before it makes sense. Every time. And some days it just doesn’t make sense no matter how long I stare at it. This particular chart shows the water level of Clary Lake on February 8th, 2022 and the elevation of the water line on that date is 149.88 feet, or 1.29 feet below the HWM. What this chart is actually showing us is the distance the lake surface is below the top of the dam, at any place along the top of the dam, starting at the left (0 feet) and proceeding to the right (98 feet). Continue reading

January 2022 Water Level Chart Archived

1 Clary-Lake-Water-Level-January-2022

January 2022

I have archived the January 2022 Water Level Chart (at left), starting off the new year with more snow on the ground than I can remember seeing for several years. Compared to recent winters, this condition bodes well for our ground water supply come spring the ground thaws this spring and the snow melts.

Our general dam management goal in the winter is to maintain a lake level somewhere around 18 inches below the HWM. This is low enough to prevent ice damage to the shoreline around the lake yet still high enough to maintain outflows sufficient to meet the minimum flows requirement of the Clary Lake Water Level Order. To that end, we’ve been successful: the lake level is currently around -1.41 feet and outflows are around 13 cfs (cubic feet per second), slightly higher than the current minimum flows which of 11.3 cfs. If you’re unclear about minimum flows, what they are, and why we are supposed to maintain them, see Minimum Flows Explained.

[UPDATED] December 2021 Water Level Chart Archived

12 Clary-Lake-Water-Level-December-2021

December 2021

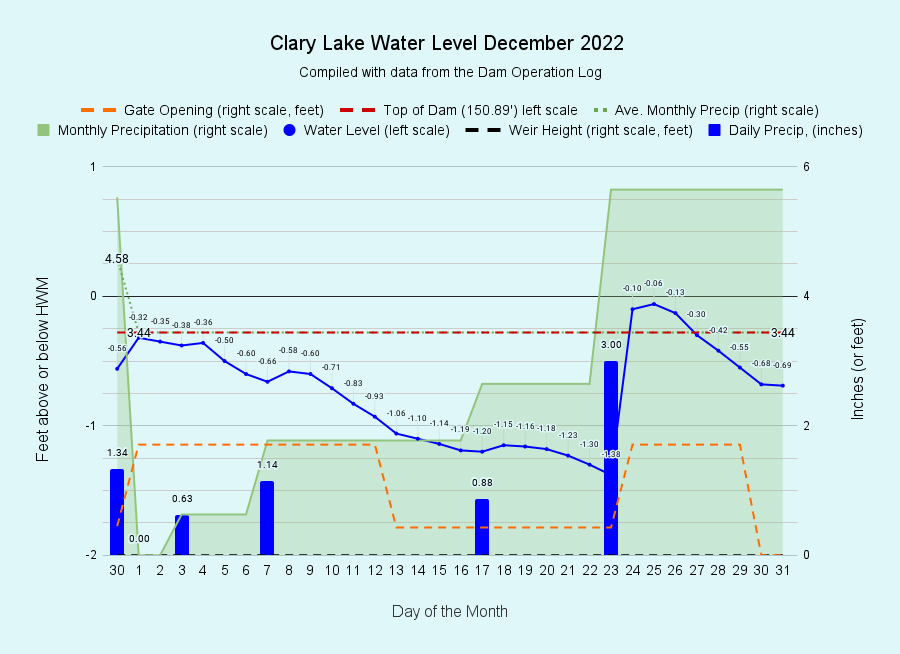
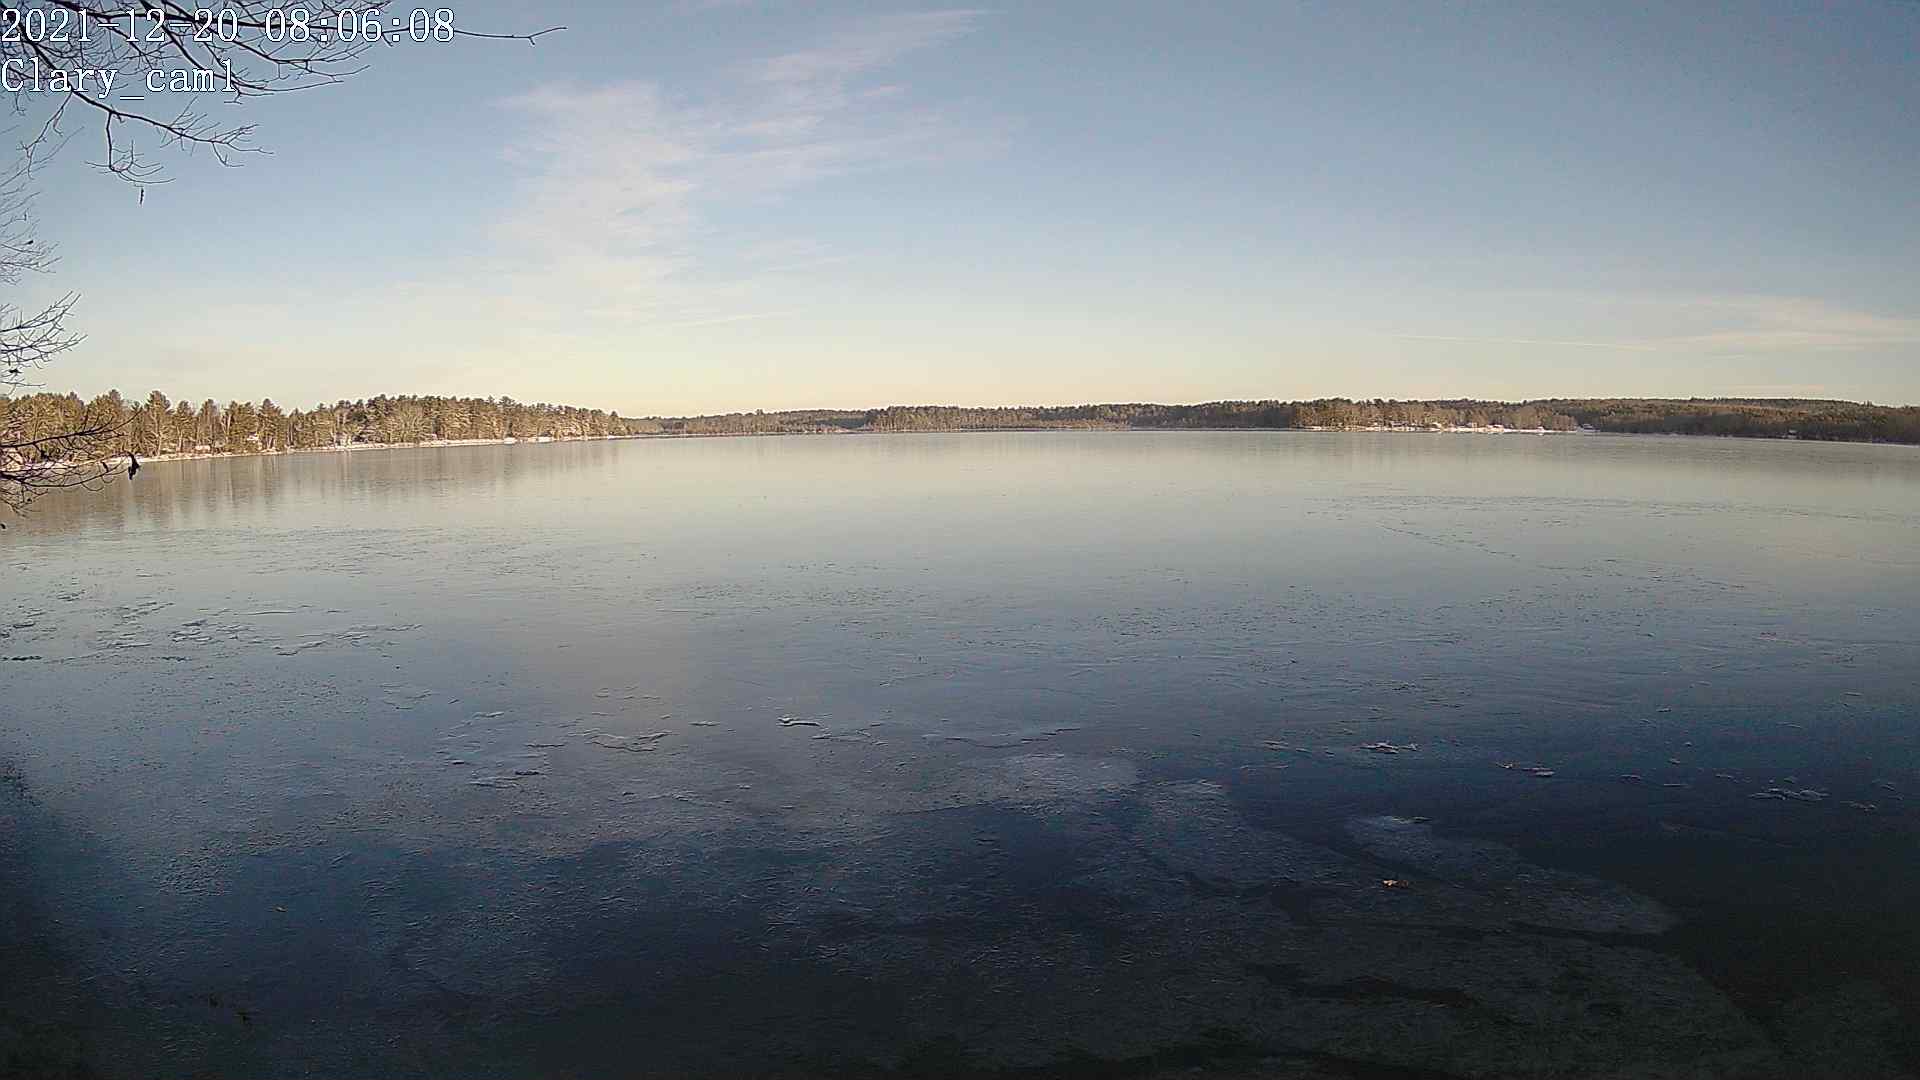
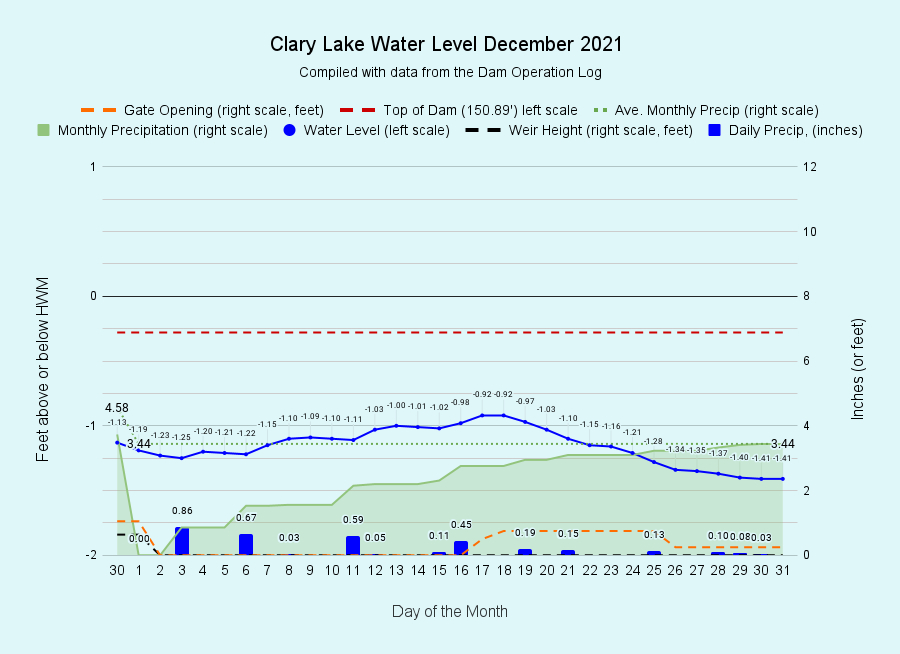
I have archived the December 2021 Water Level Chart (at left), bringing 2021 to a close. Our general goal in December is to get the lake down to about 18 inches by the time it freezes over, without overshooting the mark. We have after all only 24 inches to play with. As it turns out, the lake froze over on December 20th with the lake level down just 1 foot. Precipitation for the month was 3.44 inches, average for December, bringing us to 46.18 inches for the year, 2.12 inches more than average. It is only because of the excessive rainfall we received in July (9 inches) and September (8.5 inches) that we ended the year a bit ahead of average precipitation because for most of the rest of the year, we fell short of monthly averages. And that’s about all I’m going to say about December. It’s a New Year.

Clary-Lake-2020-Retention-Time-and-Flush-Rate-OUTFLOWS2021-Clary-Lake-Retention-Time-and-Flushing-Rate-OUTFLOW
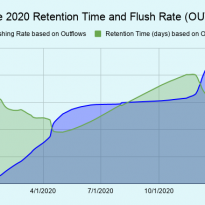
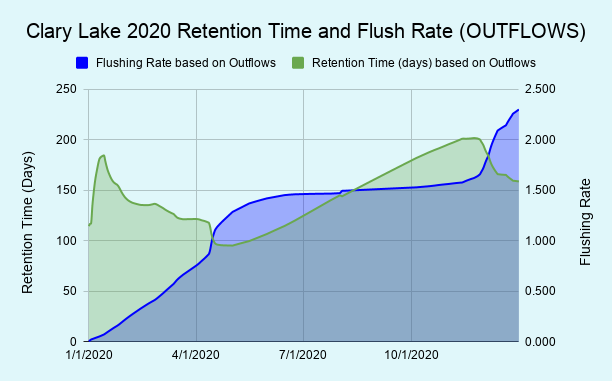
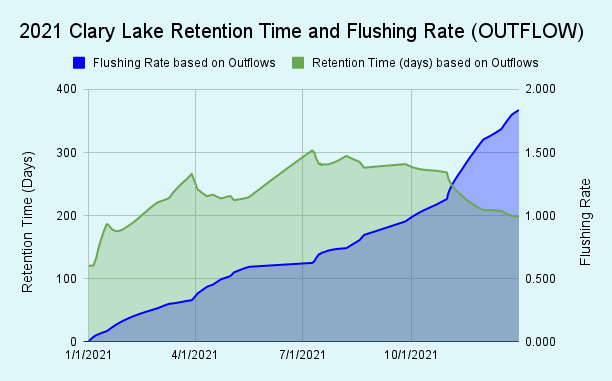
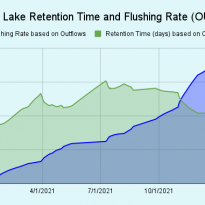
One big difference between 2020 and 2021 turned out to be the flushing rates and retention times. In 2020 we had a flushing rate of about 2.3x with a retention time of 140 days. In 2021 the flushing rate was 1.8x (the same as the published rate for Clary Lake) with a retention time of 240 days. This is in effect a measure of the amount of water that passed through Clary Lake: in 2020, a total of 16,632 acre feet of water passed through the lake, in 2021 that figure was  significantly less, only 13,274 acre feet. The lower flushing rate in 2021 very likely had a beneficial effect on water quality.

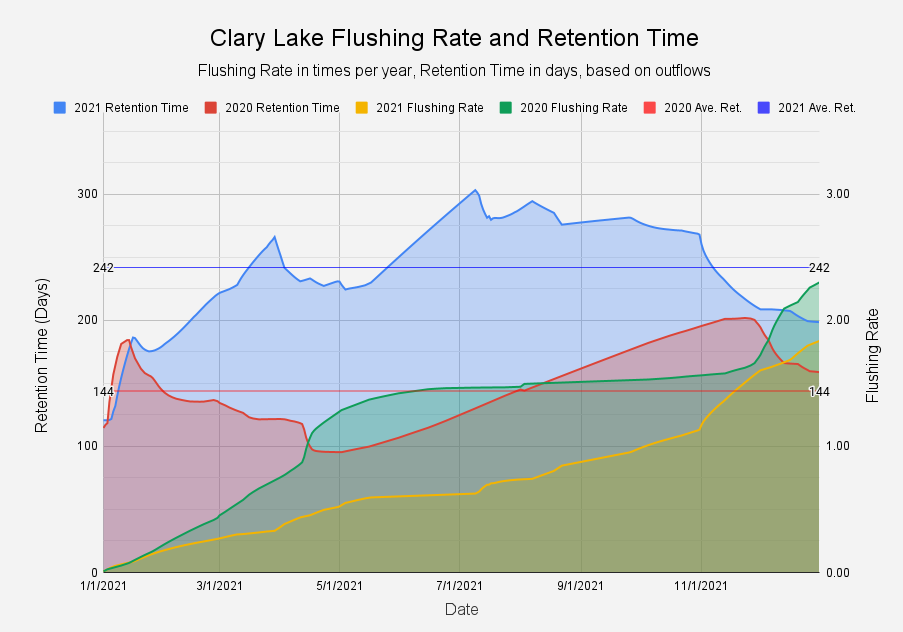
[UPDATE]: I was so intrigued with the difference in flushing rate and retention time for 2020 and 2021 that I decided to graph them to make the differences more evident. Here’s the result:

I’ll add data for 2022 as it becomes available.

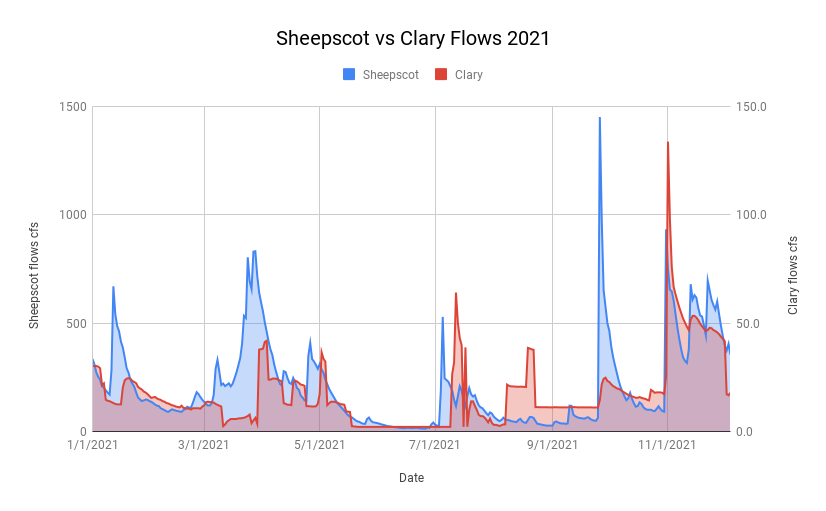
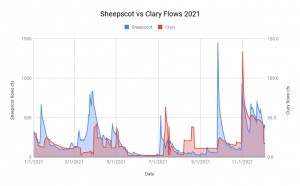
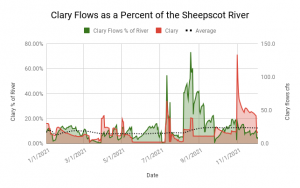
I can’t end 2021 without highlighting an interesting but ultimately useless bit of data analysis I wasted time on this year. Everyone knows that I love charts. If you don’t know that by now, then you simply haven’t been paying attention! I’d like to show you two fascinating but useless charts I made this year. First a bit of explanation. I have long thought it would be cool if I could somehow correlate the flows from Clary Lake with the flows in the Sheepscot River as measured at the Sheepscot River Gaging Station which is located at the foot of Grand Army Hill. It turns out you really can’t correlate the two flows in any reasonable fashion for two primary reasons. First, because the hydrological characteristics of the Clary Lake watershed (9.9 square miles) and that of the larger Sheepscot River watershed (142 square miles) are quite different. Clary should contribute 6.9% of the water measured at the gaging station but that figure actually varied from a low of around 1% to a high of 60% with an average of around 12.4%. Sheesh. Second, nobody actually controls the flows on the river, but we do in fact do control the outflows from Clary Lake so it is largely our own management activities that make correlating the two flows almost impossible. It would be nice if Clary outflows were always 6.9% of Sheepscot River flows, but I guess that would be too easy! Anyways, here are two charts I made while investigating whether a correlation between lake and river flows exists. One shows Clary Flows as a percentage of the Sheepscot River flows. The average turned out to be 12.43%. The other is a simple visual comparison of the two flow amounts which I did to see if anything jumped out at me. Nothing did:

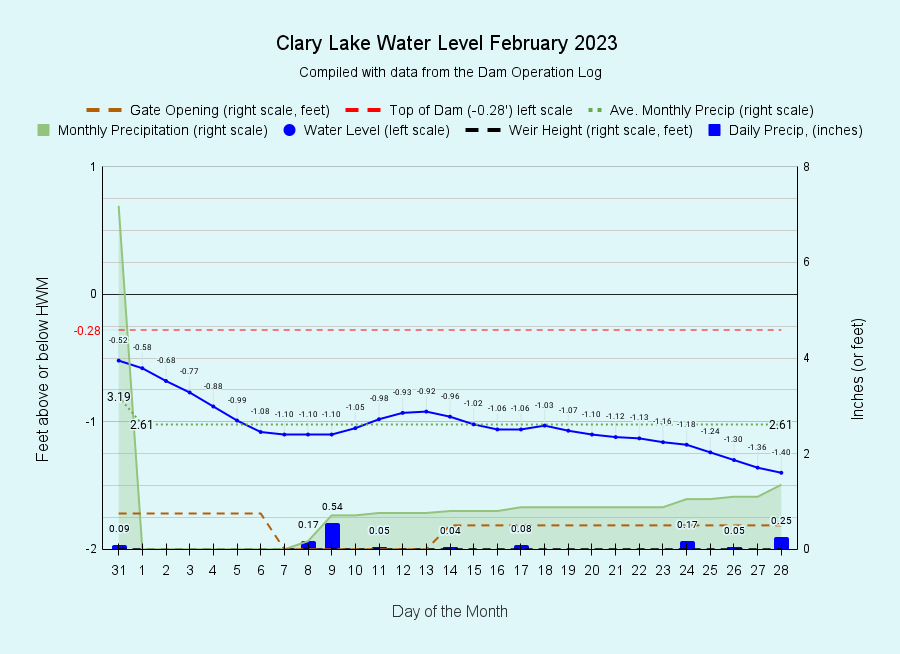
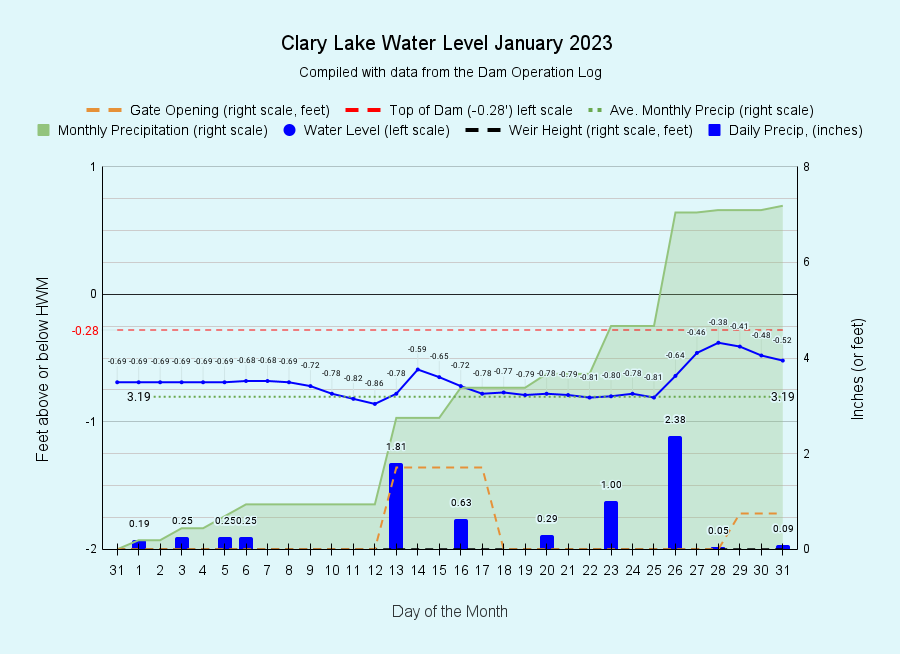
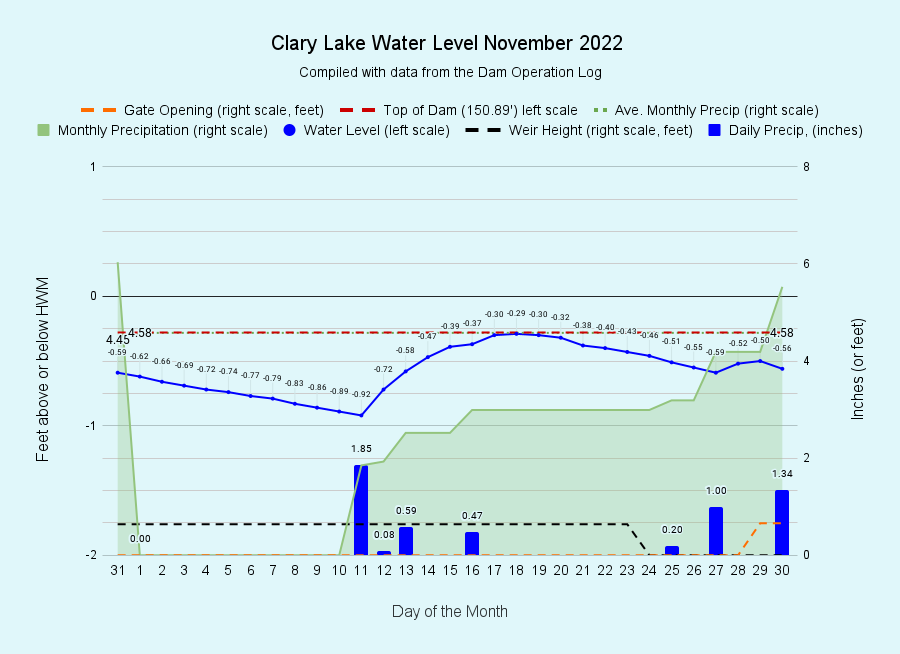
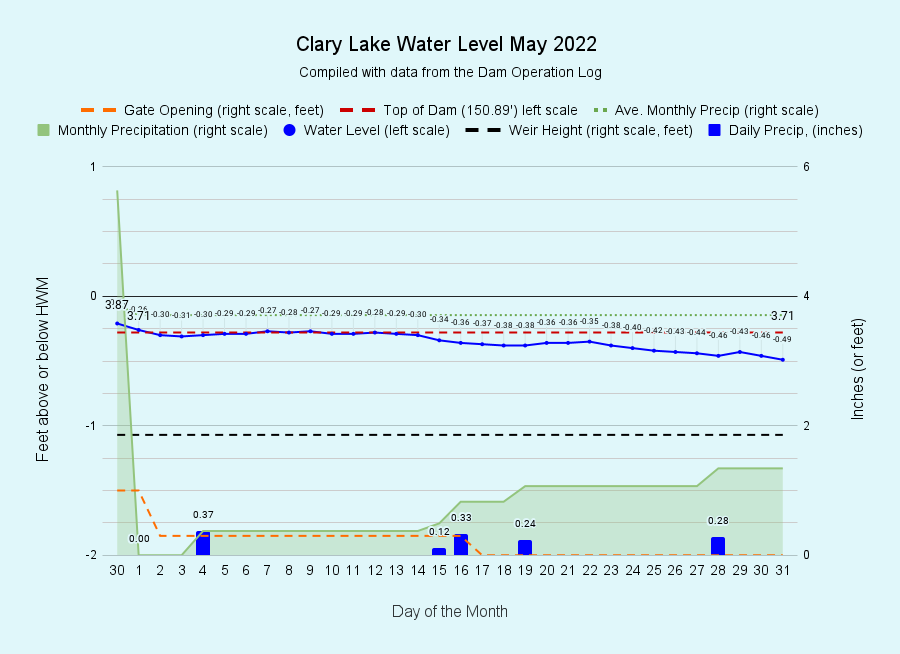
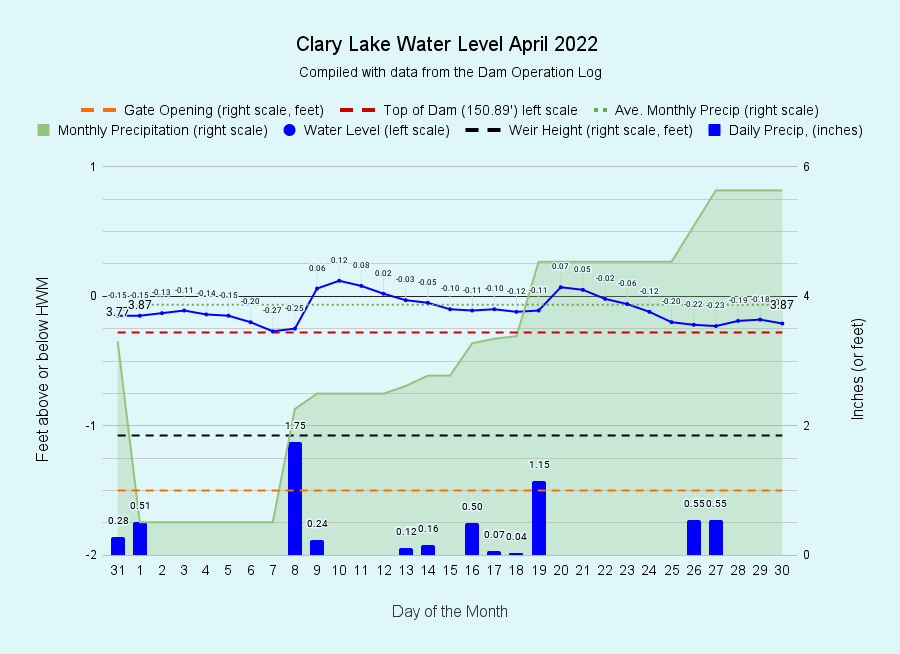
Here’s the 2021 Water Level Chart gallery:

Happy New Year everyone 🙂

20 December 2021: She’s Froze!

campic1-ice-in-12-20-2021Clary Lake has been trying to freeze over for about 3 weeks now, first at one end, then at the other. Each time it’s melted off. A good section out in front of my place has been ice free all along thanks to the ducks that come to our bird feeding station, they splash around and keep the ice from forming. Clary has just been waiting for a good cold night to freeze over, and last night was it. This morning the temperature was a paltry 9.9° F and from all appearances, the lake is now solidly frozen over. There is no sign of ducks today! Historically, A review of our Ice In and Ice Out Dates page shows that 12/20 is on the late side for the lake to freeze over. With the exception of the freak year in 2016 when the lake actually didn’t freeze over completely until January 15th, this is the latest ice-in date since the lake froze over on December 30, 2006. Continue reading

November 2021 Water Level Chart Archived

11 Clary-Lake-Water-Level-November-2021

November 2021

I have archived the November 2021 Water Level Chart (at left). The lake level in November was like a roller coaster ride. Our general plan for a dam operations in November is to get the lake level down a foot or so below the HWM in preparation for the lake freezing over sometime in December. A large rain event on the last day of October however brought the lake up to +0.25 ABOVE the high water mark, the highest the lake has been all year! On the first day of November we pulled one of the three remaining stop logs and opened the gate 1.05 feet to drain off some water which resulted in the lake level dropping 1.18 feet over over the next 12 days. Over the rest of the month we had numerous rain storms including one of 1.22 inches on the 12th and a 1.10 inch storm on the 22nd. This rainfall kept the lake level up higher than we would have liked. We ended the month with the lake level down 1.13 feet. Continue reading

October 2021 Water Level Chart Archived

10 Clary-Lake-Water-Level-October-2021

October 2021

I have archived the October 2021 Water Level Chart (at left). October was looking to be a very dry month with rainfall well below normal until the next to the last day of the month when a significant wind and rain storm blew through the area. I recorded 2.68 inches of rain by the time the weather cleared on the 31st, bringing our monthly total to 4.34 inches, just shy of the average for October of 4.45 inches. There was a major 3 day northeaster back on the 25th of the month that was forecast to drop 3-5 inches of rain here, but it turned out to be mostly a southern Maine rain event; here we received less than an inch of rain. I thought we’d end the month with the lake level down around 1 foot below the top of the dam, but instead, by the end of the day on the 31st the there was water running OVER the top of the dam, with the lake level the highest it’s been all year. This morning as I’m writing this, the lake level is 0.25 above the High Water Mark, and still rising. Continue reading

Exploring Lake Phenomena: Langmuir Circulation

From time to time I like to highlight different lake phenomena, and today’s high winds and waves are a great opportunity to discuss Langmuir Circulation. The waves today are really stirring up the water, it’s brown and quite turbid and there are long lines of white froth on the water aligned with the wind direction. I’m sure you’ve seen this phenomena before. You can see those lines of froth in the webcam picture at left. Sitting here in my upstairs home office and looking out the window down at the lake, those lines of white froth are very evident. Continue reading