April 2016
I’ve archived the April 2016 Water Level Chart (at left). The most notable feature of the April chart is that the lake level stayed pretty stable around -34″ below the top of the dam for the first 15 days of the month (despite the dam’s gate being wide open) after which point it began to fall steadily, ending the month at -47″ below the top of the dam. All in all we received only 3.33″ of rain in April which is less than the average monthly precipitation of 3.78″. This lack of rainfall has contributed to the dry conditions we’re seeing now. Most of the rainfall occurred in the first half of the month, with 2.68″ falling by April 15th which explains the relatively stable water level during that time. Only an additional 0.65″ fell during the second half of the month.
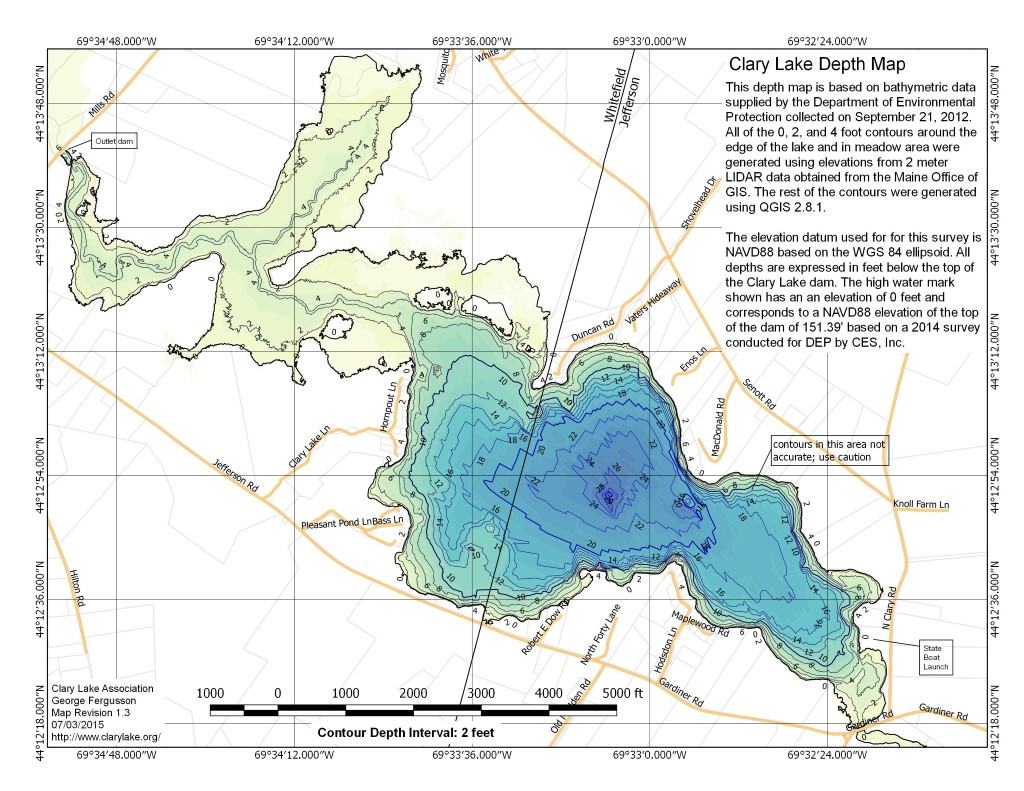 I’ve added a new statistic to the monthly water level chart, that being the volume of Clary Lake at its current level as a percentage of full. This new data has been added to the middle “narrative” portion of the Current Water Level Charts page. The figure comes from a volume analysis I’ve been working on this past winter based on the Clary Lake Depth Chart (at left) that I prepared from data collected by DEP during their September 2012 bathymetric survey and additional [the_tooltip text=”LIDAR” tooltip=”Lidar (also written LIDAR, LiDAR or LADAR) is a surveying technology that measures distance by illuminating a target with a laser light. Lidar exists as an acronym of Light Detection And Ranging. LIDAR data is typically collected from planes.” url=”” background=”” color=””] data I obtained from the Maine Office of GIS. In theory calculating volumes from a contour map is pretty straight forward and is a task most land surveyors are familiar with, but the size of Clary Lake presented some challenges and there turned out to be a considerable learning curve to the GIS software I used to extract the information I needed for my calculations. I finally got it figured out.
Currently, at -47″ below the top of the dam, the lake is about 66% full and the area has shrunk to about 473 acres of about 62% of its size when full.
My volume analysis which is based on the actual shape of the lake basin agrees very closely with a 2012 volume analysis done by David Hodsdon (his model used a simple “soup bowl” shape for the lake) and agrees reasonably closely with the “Bathymetric Assessment” prepared by DEP. The discrepancies in volume between the various models (which I do not find at all troubling) I attribute to differences in the calculation of the area of Clary Lake. Both the State’s and David’s volume analyses used a figure of of 667 acres for the area. However, I believe that when the lake is “filled to the brim” (i.e., at a NAVD88 elevation of 151.17′ which corresponds to the top of the dam per DEP survey) that the area of Clary Lake is more like 765 acres. This size includes about 89 acres that is between zero and 1 foot deep, which is why the size has little real impact on volume calculations. I am still analyzing the differences between the various models and will make a more detailed presentation including data tables and graphs at another time.
I’ll leave you with this tidbit: Clary Lake contains 2,354,585,487 gallons of water.